
Fig. 2.
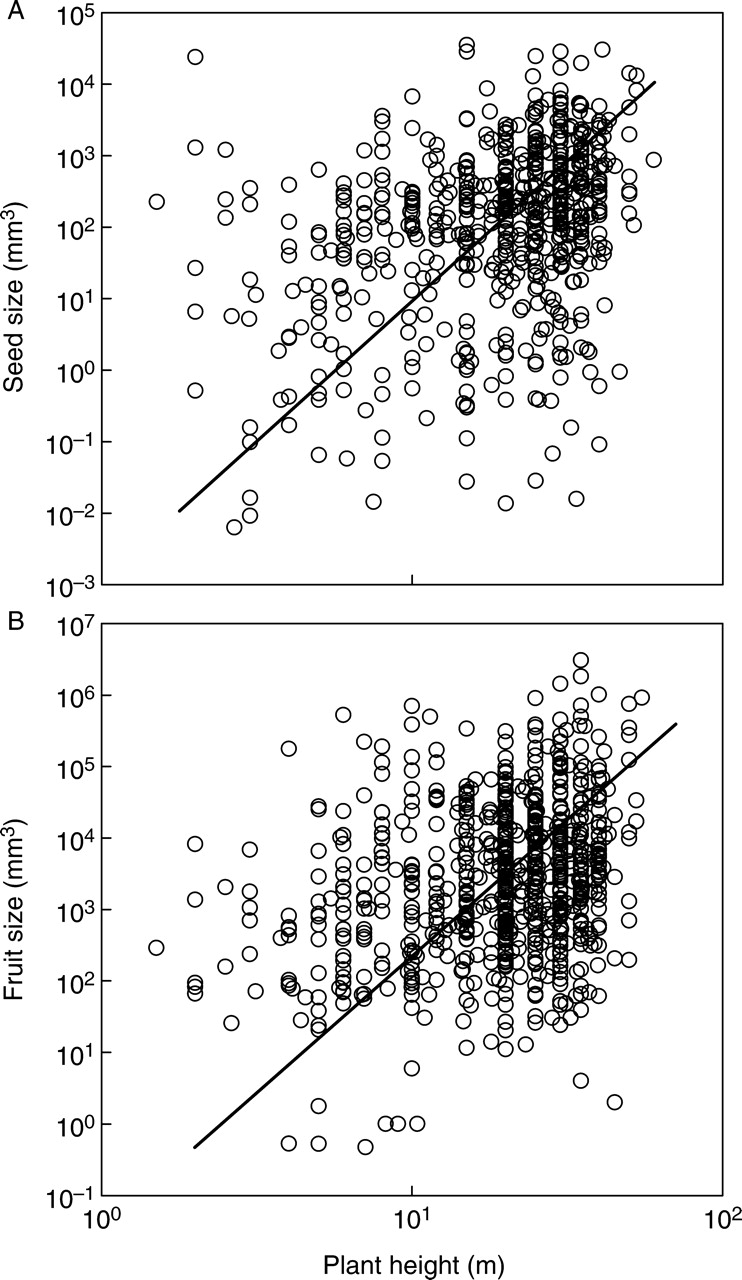
Relationships between species-mean (A) seed size and plant height, and (B) fruit size and plant height. Correlations statistics are given in Table 3. SMA slopes (and 95 % confidence interval): (A) 3·92 (3·64, 4·22), (B) 3·82 (3·58, 4·08).
Official websites use .gov
A
.gov website belongs to an official
government organization in the United States.
Secure .gov websites use HTTPS
A lock (
) or https:// means you've safely
connected to the .gov website. Share sensitive
information only on official, secure websites.
Relationships between species-mean (A) seed size and plant height, and (B) fruit size and plant height. Correlations statistics are given in Table 3. SMA slopes (and 95 % confidence interval): (A) 3·92 (3·64, 4·22), (B) 3·82 (3·58, 4·08).