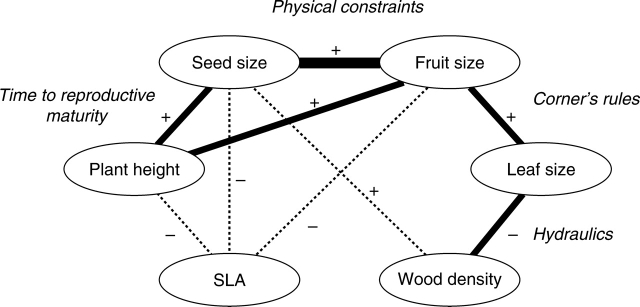
Fig. 5.
Summary of relationships among the six plant traits. The strength and consistency of the relationship among any pair of traits is indicated by the thickness of the line connecting them, dotted lines indicating the weakest and most inconsistent relationships. The main hypothesized factor underlying the relationship is indicated (see Discussion), as well as the sign (positive or negative) of the relationship.

