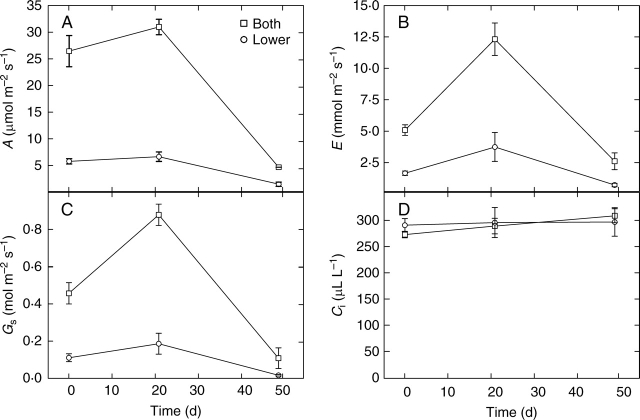
Fig. 4.
(A) The rates of photosynthetic CO2 assimilation (A), (B) stomatal conductances to CO2 (Gs), (C) rates of transpiration (E) and (D) intercellular CO2 concentrations (Ci) for the lower surface and both (upper + lower) surfaces of the middle portion of the prostrate leaves of B. orientalis measured at three time points starting on 2 September. Values are the means and bars indicate the s.e. (n = 6).

