
Fig. 4.
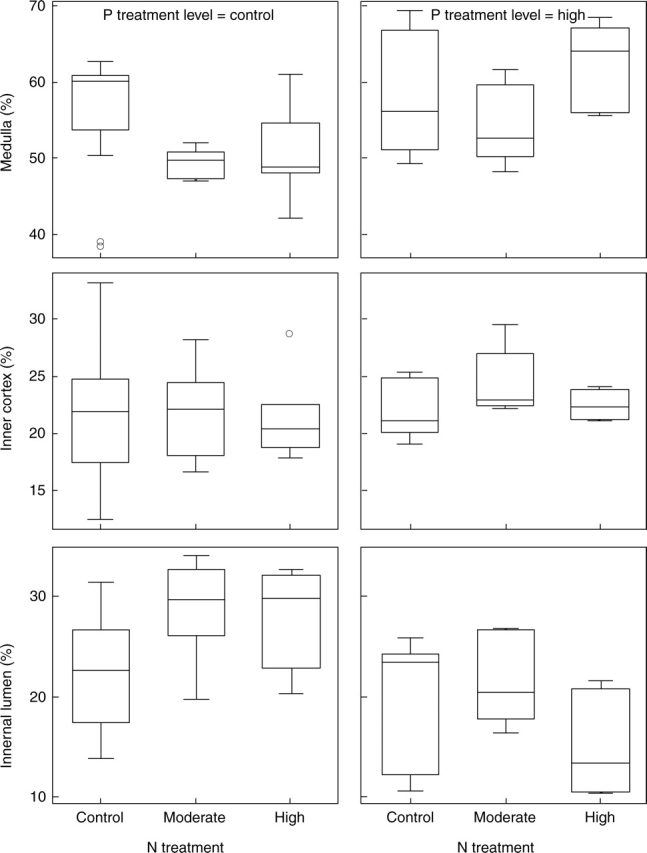
Box-plot showing the volumes (% of thallus volume) of medulla, inner cortex and internal lumen in C. stellaris after N and P treatments. The line in the box indicates the median value of the data values. The ends of the vertical lines indicate the minimum and maximum data values. Asterisk = extremes; circle = outliers.