
Fig. 6.
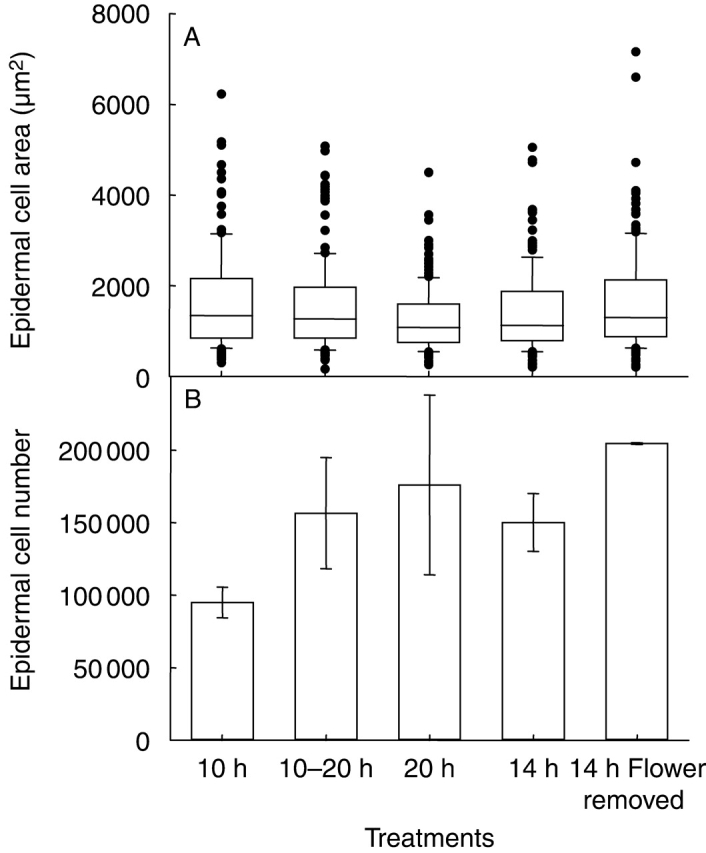
Epidermal cell area of leaf 9 of Ler plants grown under various day lengths, with or without the flower bud excised, during expts 4 and 5. Box plots (A) represent the distribution of the data around the median as in Fig. 5 and histogram (B) shows mean epidermal cell number with s.d. error bars, n = 3.