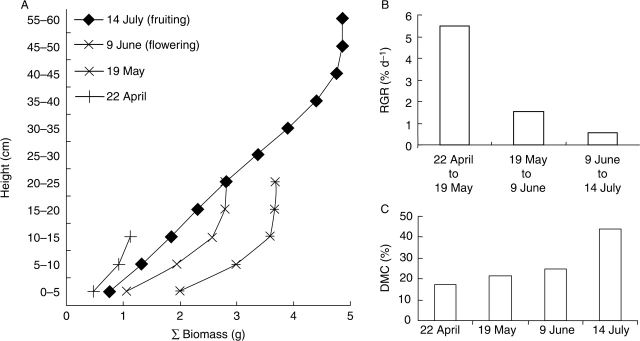
Fig. 3.
Development of one Aira caryophyllea L. individual during the growing season for (A) vertical distribution of dry biomass (sum-curves giving total biomass below the respective reference height), (B) relative growth rate (RGR) during different time intervals and (C) dry matter content (DMC) on different dates.

