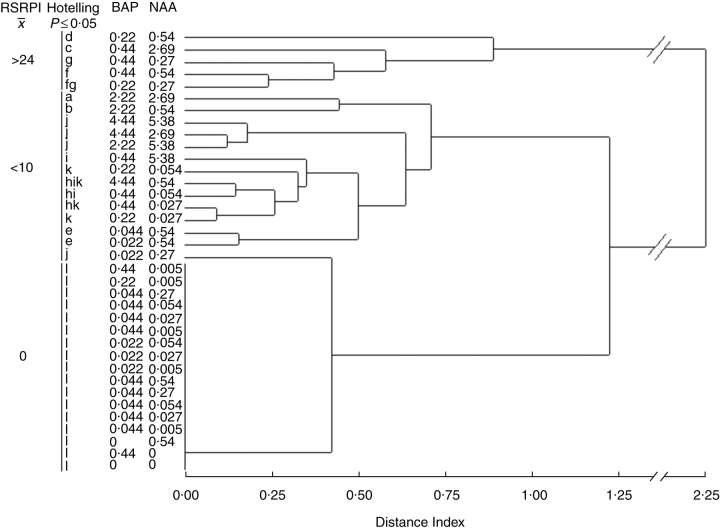
Fig. 10.
Phenogram of 36 OTUs (36 media) and three characters (the percentage of explants with an SR, the number of SRs per explant and the SR dry weight per explant) resulting from the UPGM cluster analysis of the OTU × OTU distance matrix. The coefficient used was the average Euclidean distance. Different letters indicate statistically significant differences between the results of the different media according to Hottelling's test (P ≤ 0·05). Clusters can be related to RSRPI (relative storage root production index).

