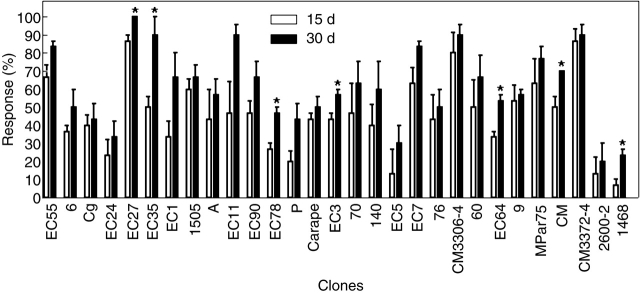
Fig. 4.
Effect of genotype on the capacity for in vitro SR formation: percentage of explants with an SR. Data are means ± s.e. of three replications. The asterisks indicate statistically significant differences between the percentage of explants with an SR scored at 15 and 30 d, according to Duncan's multiple comparison test (P ≤ 0·05).

