
Figure 2.
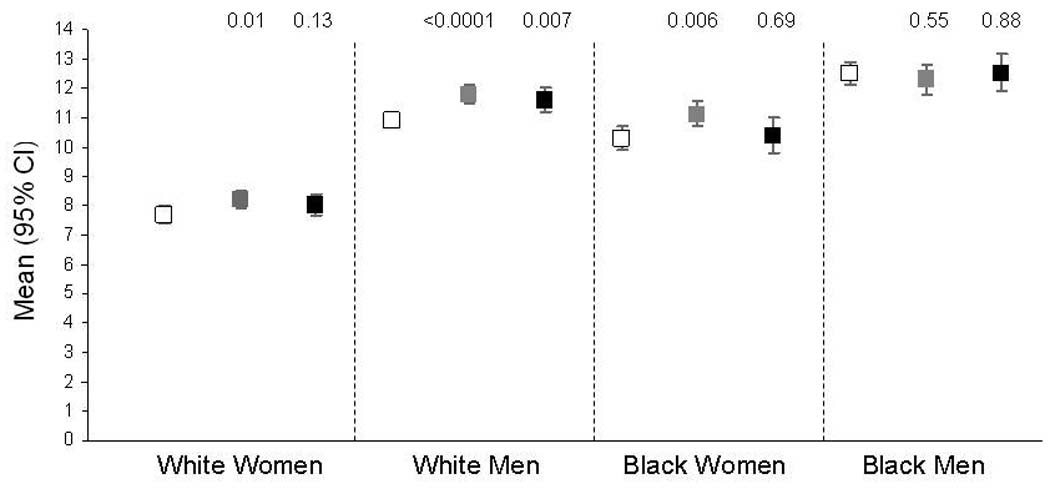
Mean Age-adjusted Framingham Stroke Risk Score by Sex, Race and Region. Error bars are 95% confidence interval of the mean. P values are for comparison to stratum-specific “rest of the nation” region. Open squares are the rest of the nation, gray squares are the stroke belt and black squares are the stroke buckle.