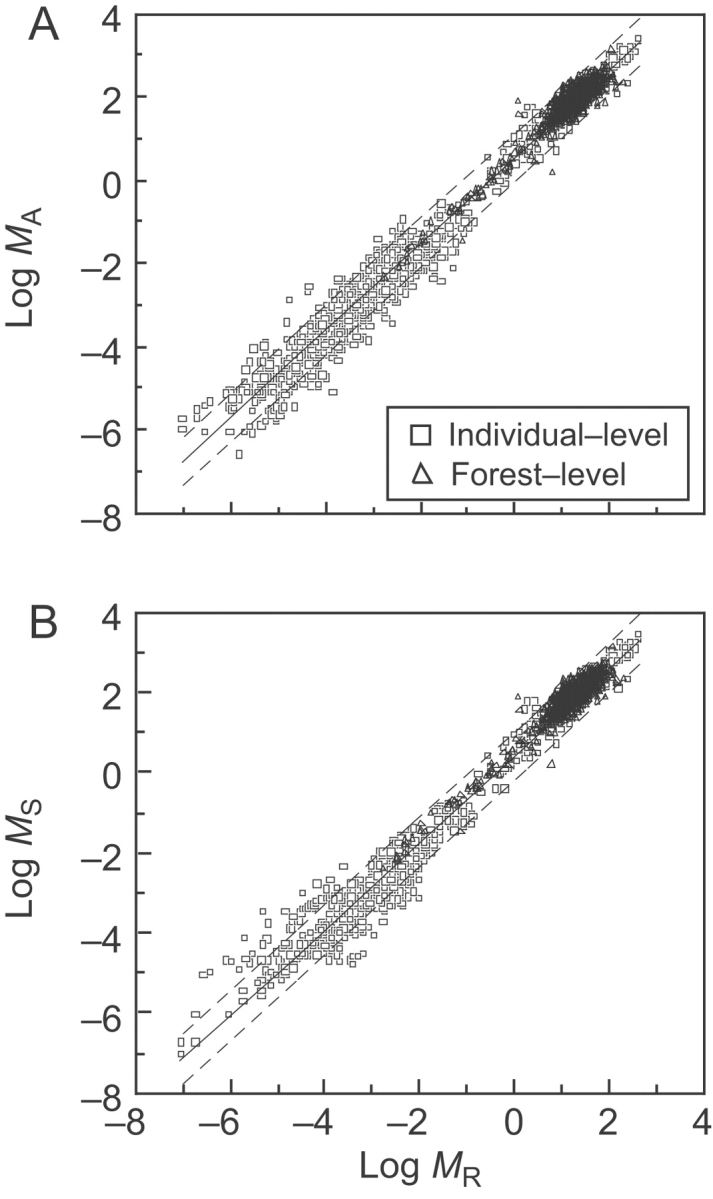
Fig. 1.

Log–log bivariate plots of above- vs. below-ground (root) biomass (MA vs. MR) and stem vs. root biomass (MS vs. MR) at the level of individual plants (n=1406) and Chinese forest samples (n=1534). [Note that the raw data in each plot have comparable numerical values when log-transformed despite differences in their original units, i.e. kg dry mass per individual (see Niklas, 2005) and metric tonnes dry mass ha−1 (see Luo, 1996; Feng et al., 1999).] Solid lines are RMA regression curves; dashed lines denote ±2 s.d. (A) MA vs. MR. αRMA=1·04 (r2=0·985, F=207,309, P<0·00001). (B) MS vs. MR. αRMA=1·08 (r2=0·981, F=131,690, P<0·00001).
