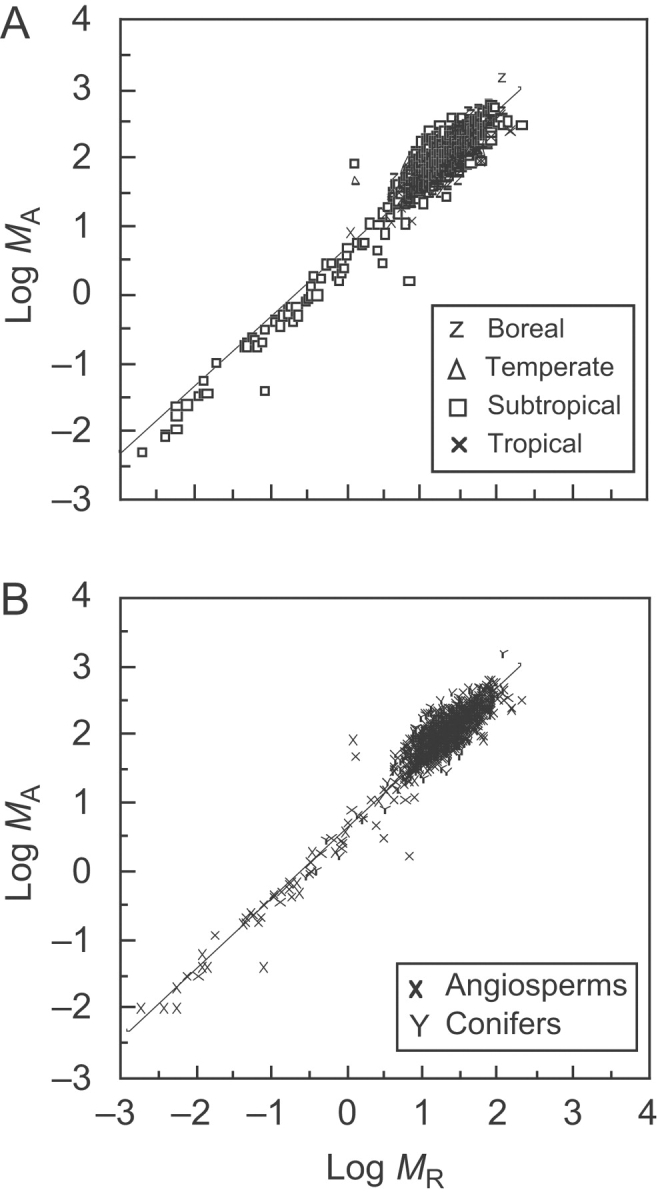
Fig. 3.

Log–log bivariate plots of forest-level standing above- and below-ground biomass (MA and MR, respectively) relationships for data compiled by Luo (1996) and Feng et al. (1999) sorted into four representative data subsets for forest-community types (A) and into angiosperm- or conifer-dominated communities (B). Original units are metric tonnes per hectare. Solid lines are RMA regression curves; for statistical parameters see Tables 1–4.
