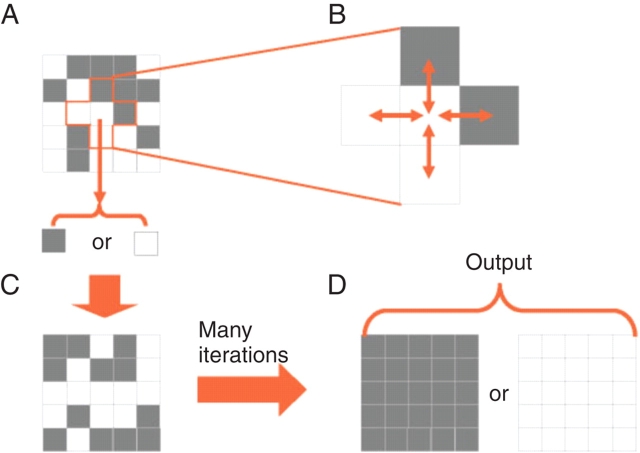
Fig. 2.
Diagrammatic representation of the majority classification task. The system consists of a two-dimensional network of units (A), represented in the diagram as squares, each of which (B) receives input from itself and its four nearest neighbours. Each unit can exist in one of two states, denoted as black and white in this diagram. The network starts with some distribution of states, and the goal of the dynamics is to determine which state is in the majority. The dynamic solution proceeds by each unit updating its state according to a simple rule that depends on its own state and the states of its neighbours (C). The task is performed successfully when all units assume the state (D) (possibly after many time steps) that was initially in the majority (white, in the example shown).

