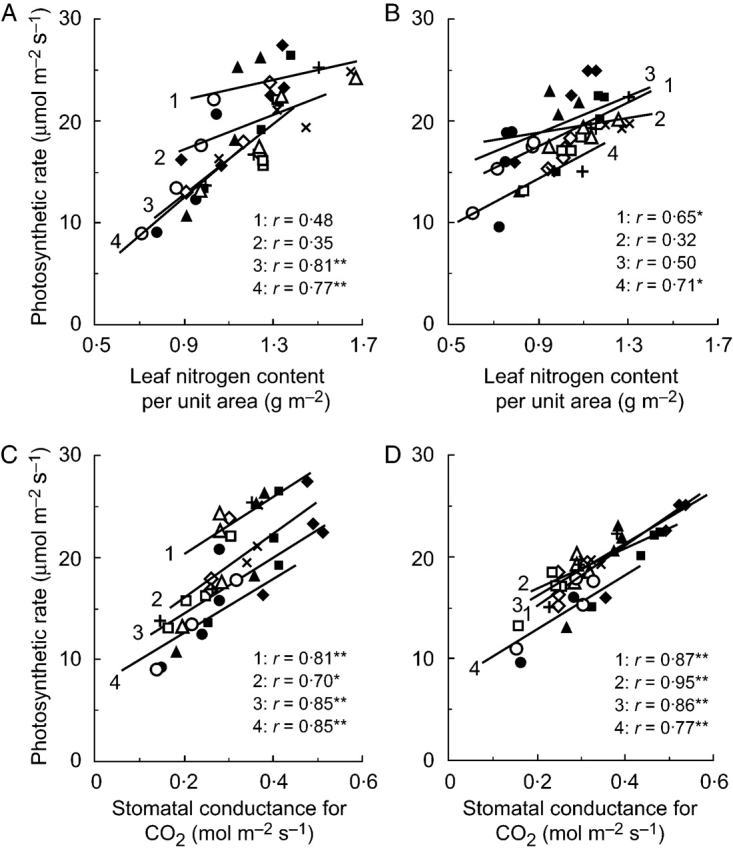
Fig. 3.

Relationships between photosynthetic rate and nitrogen content per unit area of leaves (A, B), and stomatal conductance for CO2 (C, D) of ten rice genotypes measured at four different developmental stages from field experiments in 2001 (A, C) and 2002 (B, D). The number on the lines show the developmental stage: 1, panicle initiation to 2 weeks before heading (2 WBH); 2, 2 WBH to heading; 3, heading to 2 weeks after heading (2 WAH); 4, 2 WAH to maturity. Symbols are the same as in Fig. 2. *denotes significance at the 5% level, and **at the 1% level.
