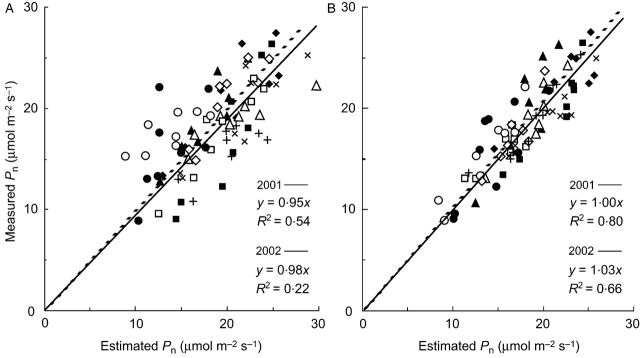
Fig. 5.
Relationships between measured and estimated leaf photosynthetic rate (Pn; μmol m−2 s−1) by the models (eqn 4) assuming that the internal conductance (gw) is proportional to leaf nitrogen content per unit area (A), and that gw is proportional to stomatal conductance (B), in 2001 (solid line) and 2002 (dashed line) field experiments. The parameter values estimated from the 2001 experiment were applied to the 2002 model analysis. Data points include those at four different developmental stages from panicle initiation to maturity. Symbols are the same as in Fig. 3. All the relationships are significant at the 1% level.

