Fig. 2.

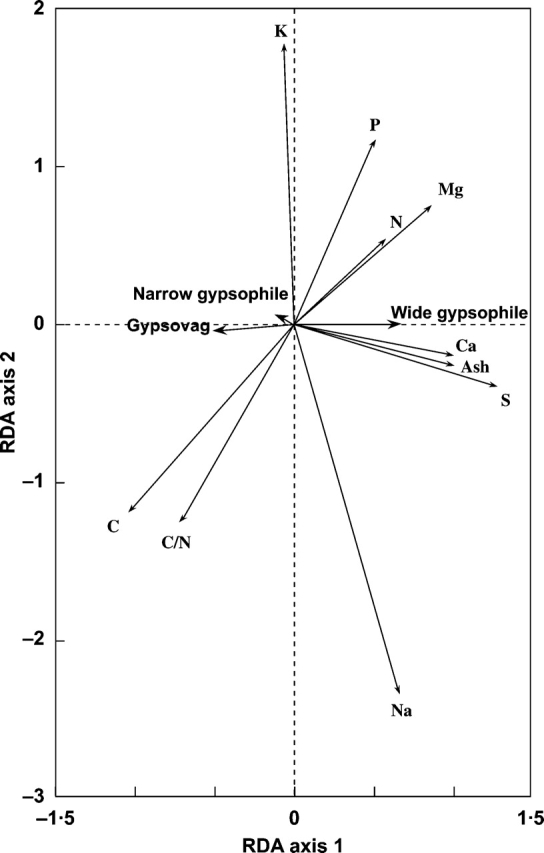
Biplot for the RDA model analysing the effect of the ‘gypsum plant type’ separately from the rest of classificatory variables. P = 0·002, F = 64·102, TVE = 50·2%. See text for further details of calculations.

Biplot for the RDA model analysing the effect of the ‘gypsum plant type’ separately from the rest of classificatory variables. P = 0·002, F = 64·102, TVE = 50·2%. See text for further details of calculations.