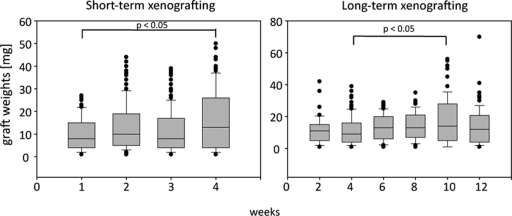
Figure 2.
The distribution of graft weights in xenografts after short- and long-term grafting.
The median of the graft weights (black line) and lower and upper quartiles (gray box) are presented. Whiskers extend to the 5th and 95th percentile, respectively. Left: graft weights significantly increased between 1 and 4 weeks (ANOVA on ranks, n = 71–157). Right: graft weights significantly increased between 4 and 10 weeks (ANOVA on ranks, n = 46–122).

