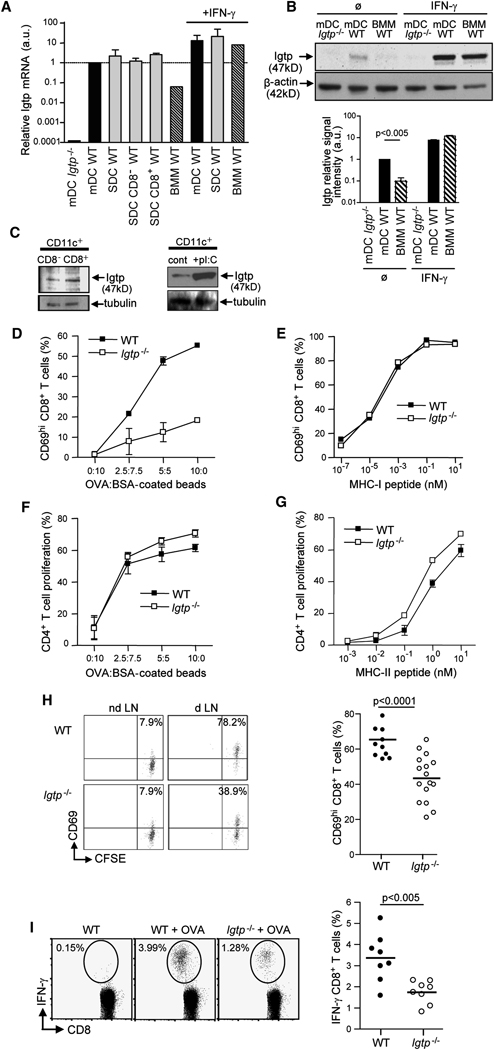
Figure 1. Irgm3 is expressed in DCs and regulates cross-presentation.
(A) Relative Irgm3 mRNA expression in DCs (mDCs and Spleen DCs) and BMMs was measured by RT-PCR.
(B) IB analysis of Irgm3 expression in cell lysates from mDCs and BMMs. Densitometric quantification of Irgm3 signal intensity rapported to β-actin loading control.
(C) IB analysis of Irgm3 expression in cell lysates from CD11c+ spleen DCs subsets sorted on CD8 expression (upper panel) or total spleen DCs sorted 8 hours after the injection of 50 µg polyI:C (lower panel). α-tubulin is shown as a loading control.
(D, E) In vitro cross-presentation of OVA:BSA coated beads (D) and MHC I OVA peptide loading (E) by WT or Irgm3−/− mDCs. CD8+ T cell activation was determined by measuring CD69 upregulation after overnight incubation with fixed mDCs.
(F, G) In vitro MHC II presentation of OVA:BSA coated beads (F) and MHC II OVA peptide loading (G) by WT or Irgm3−/− mDCs. CD4+ T cell proliferation was determined by CFSE dilution after 3 days of coculture with fixed mDCs.
(H) In vivo cross-presentation after sc immunization of WT or Irgm3−/− mice with anti-DEC205-OVA. In situ cross presentation was monitored by CD69 upregulation in adoptively transferred anti-OVA OT-I transgenic cells at d1 (left panel). Results from three independent experiments are represented (right panel).
(I) In vivo cross-priming in WT or Irgm3−/− mice immunized with polyI:C and OVA-loaded apoptotic bodies. Anti-OVA polyclonal CD8+ T cell response was monitored at d8 after OVA peptide restimulation and IFN-γ intracellular staining (left panel). Data from three independent experiments are represented (right panel).

