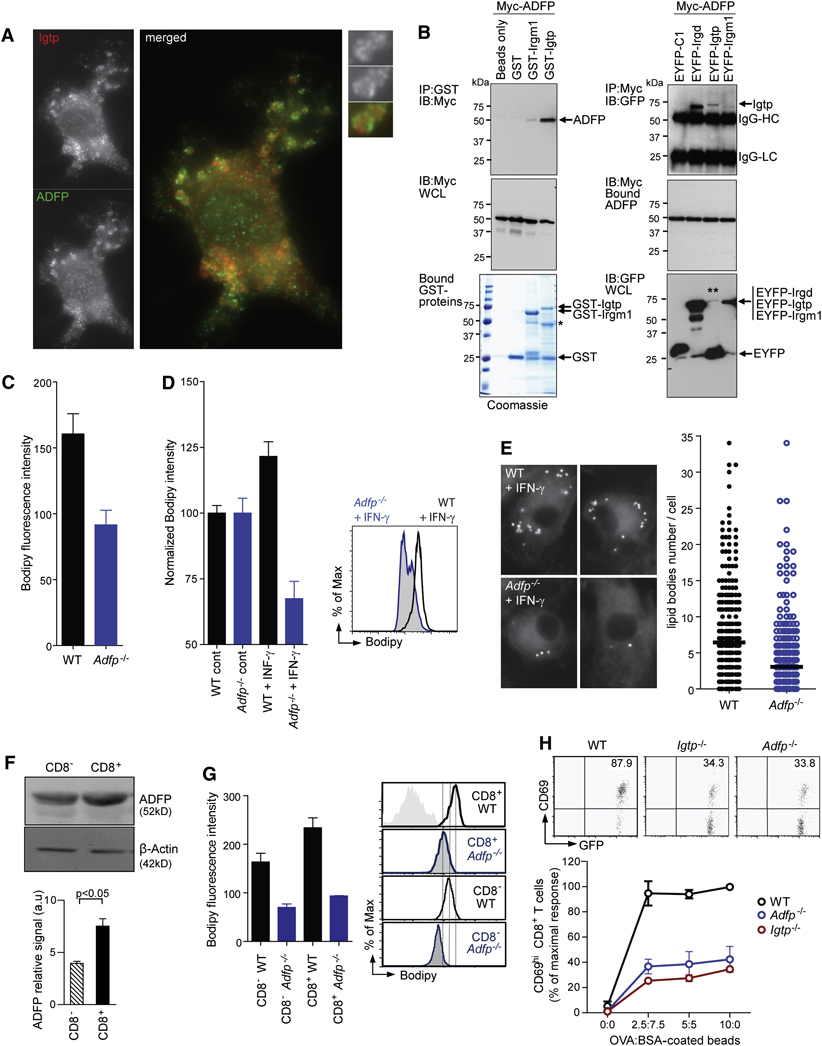
Figure 7. ADRP interacts with Irgm3 and controls LB formation and cross-presentation.
(A) IF of WT mDCs treated with IFN-γ fixed and stained for Irgm3 (red) and ADRP (green).
(B) Left: Immunoblot (IB) of ADRP interactions with recombinant GST-Irgm3 and another p47 GTPase, GST-Irgm1, pre-bound to glutathione-Sepaharose 4B beads. GST and beads alone served as negative controls. Comparable levels of Myc-ADRP expression in HEK whole cell lysates (WCL, middle panel) before incubation with purified GST-tagged proteins pre-bound to Sepharose beads (bottom panel). Single asterisk denotes position of cleaved GST-Irgm3 in addition to the full-length protein after bead incubation. One of two experiments is shown. Right: Co-immunoprecipitation of Irgm3 with ADRP in human HEK cells. IB of EYFP-Irgm3 retrieved by Myc-ADRP on Protein G resin. EYFP-Irgd and EYFP-C1 were used as positive and negative controls, respectively (top panel). Double asterisk denotes low levels of full-length EYFP-Irgm3 due to instability in whole cell lysates (bottom panel). IgG-HC, immunoglobulin G heavy chain; IgG-LC, immunoglobulin G light chain. One of four similar experiments is shown.
(C) FACS analysis after Bodipy staining of non activated CD11c+ mDCs from WT or Adrp−/− mice (WT=160.6±15.3; Adrp−/−=91.6±15.3, p<0.05).
(D, E) LB quantification in WT or Adrp−/− mDCs treated with IFN-γ using Bodipy staining and FACS analysis (D) or LB counting by IF (E). In (D), results are normalized to 100 in the control cells (WT+IFN-γ=121.5±5.6, Adrp−/−+IFN-γ=67.5±6.6, p<0.0001, t test). An example of FACS analysis is shown. In (E), IFN-γ activated cells were submitted to LB counting by IF (WT+IFN-γ=6.44±0.36 n=372, Adrp−/−+IFN-γ=3.38±0.36, n=393, p<0.0001, t test).
(F) IB analysis of ADRP expression in cell lysates from CD8− and CD8+ spleen DC subsets. Densitometric quantification of ADRP signal intensity rapported to the β-actin loading control (three independent experiments ± SEM, statistical significance was assessed by t test).
(G) FACS analysis of splenic DC subsets from WT or Adrp−/− mice. Representative FACS fluorescence histograms of splenic CD11c+CD8− and CD11c+CD8+ subsets stained with Bodipy from WT (black lines), Adrp−/− (blue lines). Mean fluorescence intensity values from three independent experiments were plotted as the average ± SEM. (WT CD8−=163.7±18, Adrp−/−CD8−=70.17±7, p<0.01, WT CD8+=234±20, Adrp−/−CD8+=93.57±1, p<0.005 t test).
(H) In vitro cross-presentation of OVA- coated beads by CD11c+ spleen DCs from WT (black), Irgm3−/− (red) and Adrp−/− (blue). Cross-presentation is monitored by CD69 upregulation in anti-OVA OT-I CD8+ T cells in three independent experiments, each one normalized to the maximal OT-I response (mean ± SEM).

