Figure 4.

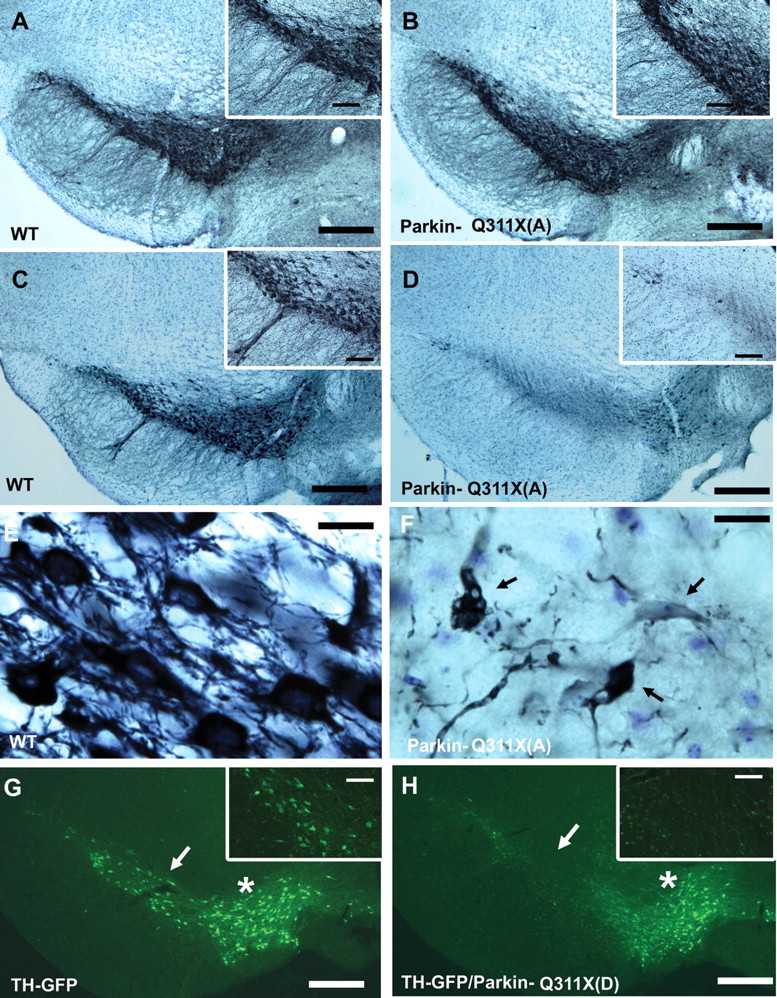
Progressive loss of SNc DA neurons in Parkin-Q311X transgenic mice. A, B, Photomicrographs of TH immunostaining of representative midbrain sections showing DA neurons in the SNc of Parkin-Q311X(A) and WT littermates at 3 months of age. Scale bar, 250 μm. The insets on the right top corner are higher-power views of the SNc area in A and B. Scale bar, 125 μm. C, D, Photomicrographs of TH immunostaining of midbrain sections for Parkin-Q311X(A) mice and wild-type littermates at 16 months of age (scale bar, 250 μm) and the higher-power view of the SNc area in C and D (scale bar, 50 μm). E, F, Higher-power view of the TH-immunoreactive neurons in Parkin-Q311X(A) mice and wild-type littermates at 16 months of age. Scale bar, 12.5 μm. G, H, Photomicrographs of direct visualization of GFP-expressing neurons in the representative midbrain sections from TH-GFP/Parkin-Q311X(D) mice and TH-GFP control mice at 16 months of age. Scale bar, 250 μm. The white arrows in the photomicrographs indicate SNc area. The white stars indicate the VTA.
