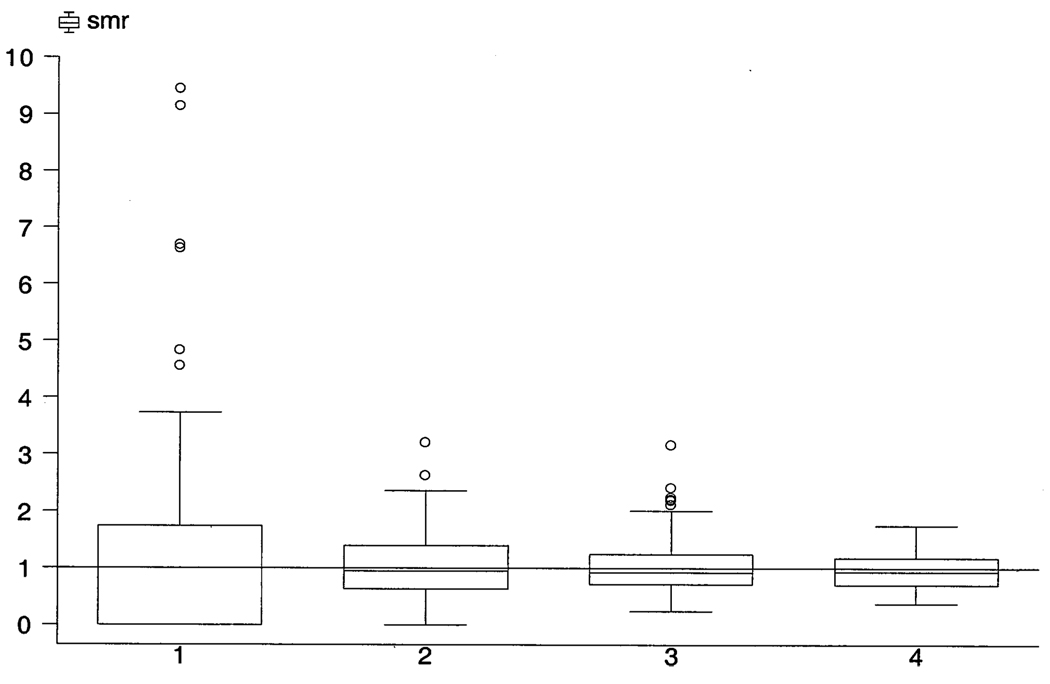
Figure 1.
Box and whisker plot of hospitals’ standardized mortality ratios by percutaneous coronary intervention (PCI) volume groups. X-axis: hospital PCI volume groups (1 = low-volume, 2 = medium-volume, 3 = high-volume, 4 = very high-volume). Y-axis: standardized mortality ratio. smr = standardized mortality ratio.

