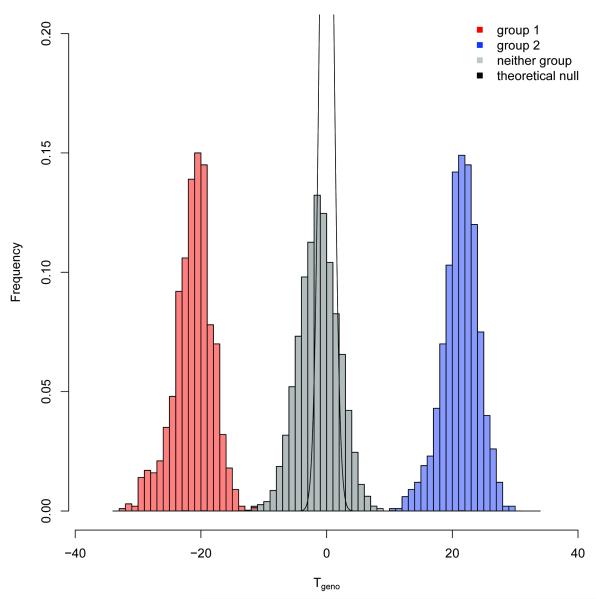
Figure 2. Histograms of calibrated Tgeno and Homer’s Tallele with 1,000 cases and controls and varying numbers of SNPs.
The figure presents theoretical null density curves (black) for a GWAS with 1,000 cases (group 1 in red), 1,000 controls (group 2 in blue) and 12,000 subjects not in the study (in gray) using genotypes for (a) 10,000, (b) 100,000, and (c) 550,000 top associated SNPs from the Illumina HumanHap550 assay. Statistics were calibrated so that the null distribution was centered at zero with unit variance.

