
Figure 2. Crawling T Cells Rearrange Chemokine-Stimulated High-Affinity LFA-1 in Scattered Dots Enriched with Endothelial ICAM-1.
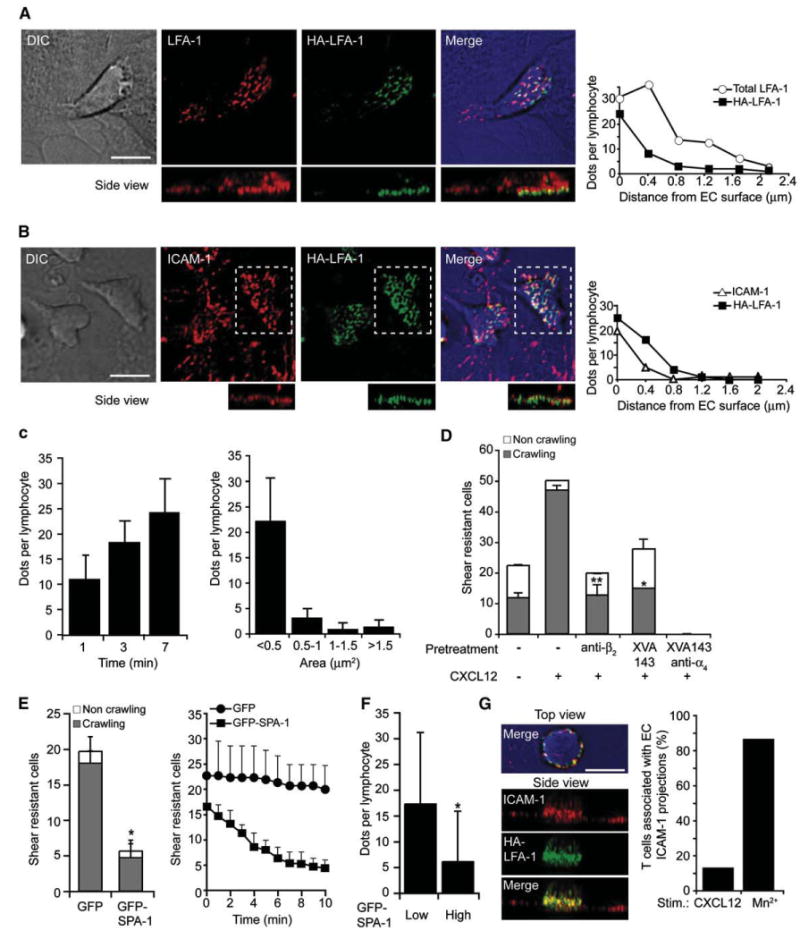
(A) T cells crawling for 7 min on activated HUVEC overlaid with CXCL12 under shear flow were fixed and stained for HA-LFA-1 (via the 327C reporter, green) and total LFA-1 (via the anti-αL mAb TS2/4, red). Right graph: analysis of LFA-1 and HA-LFA-1 dot density per individual Z-sections constituting the indicated side view projections.
(B) T cells crawling on a similar HUVEC monolayer were fixed as in (A) and stained with mAbs to HA-LFA-1 (green) and ICAM-1 (red). In the bottom panels, the side view projections correspond to the dashed rectangles. Right graph: analysis of ICAM-1 and HA-LFA-1 dots density in individual Z-sections as in (A). Scale bar represents 6 μm.
(C) Left: density of HA-LFA-1 dots underneath T cells fixed at various time points on the activated HUVEC. Mean density ± SD of 10 crawling T cells in each group. Right: size distribution of HA-LFA-1 dots in T cells crawling for 7 min. Mean ± SD of 30 crawling T cells from independent experiments is shown.
(D) Effects of XVA143 (1 μm) and integrin-blocking mAbs (20 mg/ml) on shear-resistant adhesion and crawling of T cells analyzed over a 7 min period. Values are the mean ± range of two fields in each experimental group. *p < 0.02, **p < 0.003 for control versus mAb and XVA143-treated crawling T cells. The experiment is a representative of three.
(E) Left: shear-resistant adhesion and crawling of T cells transiently transfected with either GFP-SPA-1 or GFP on CXCL12-bearing HUVEC analyzed as in (D). Right: detachment over time of initially arrested lymphocytes. The experiment is a representative of three.
(F) Density of HA-LFA-1 dots underneath T cells expressing low or high GFP-SPA-1 fixed 3 min after arrest on CXCL12-bearing HUVEC.
(G) T cells were perfused over activated HUVEC in binding medium containing 2 μm Mn2+, fixed after 7 min and stained for ICAM-1 (red) and HA-LFA-1 (green). Right graph: fractions of CXCL12- versus Mn2+-stimulated T cells engulfed by ICAM-1 clusters extended at least 1.2 μm above the EC surface.