
Figure 3. T Cells Crawling under Shear Flow Generate Short-Lived HA-LFA-1 Dots Independently of Endothelial Machineries.
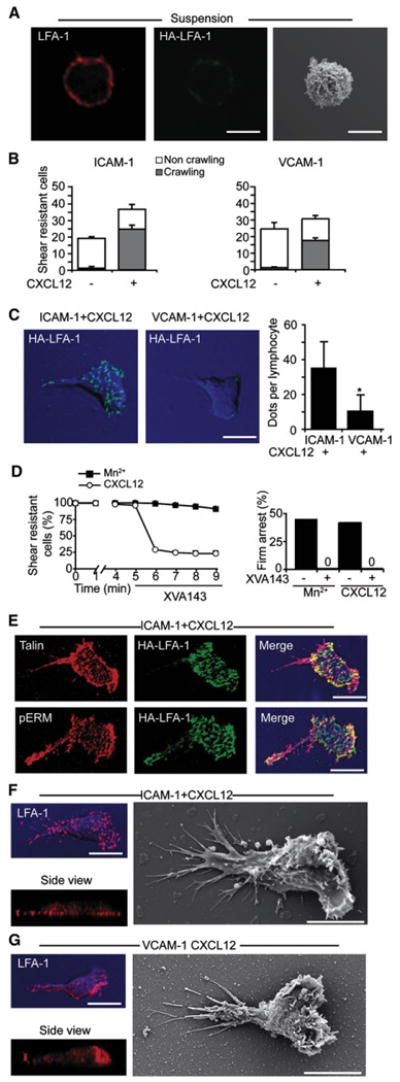
(A) T cells were fixed in suspension and stained for LFA-1 (red) and HA-LFA-1 (green). Right: SEM image of a representative resting T cell.
(B) Equal number of T cells accumulated on purified ICAM-1 or VCAM-1 coimmobilized without or with CXCL12 were subjected to a shear stress of 5 dyn/ cm2 for 7 min. Values are the mean ± range of two fields in each experimental group.
(C) T cells crawling on the indicated substrates under shear flow as in (B) were fixed and stained for HA-LFA-1 (green). DIC images (blue) overlaid with fluorescence images are depicted. Right graph: the density of HA-LFA-1 dots underneath T cells crawling on ICAM-1 or VCAM-1, each coimmobilized with CXCL12. Values are the mean ± SD of 20 crawling T cells in each experimental group. *p < 0.00001.
(D) Left: T cells crawling on ICAM-1+CXCL12 or arrested on ICAM-1 in presence of Mn2+ (2 μm) were exposed to XVA143 (1 μm) 5 min after arrest. The fractions of T cells remaining resistant to detachment thereafter are shown. Right: effect of XVA143 on the frequency of T cells arrested on ICAM-1 in the presence of the indicated LFA-1 stimuli.
(E) T cells crawling on ICAM-1+CXCL12 as in (B) were costained for HA-LFA-1 (green) and talin (red) or pERM (red).
(F and G) T cells crawling on ICAM-1 (F) or on VCAM-1 (G), each coimmobilized with CXCL12, were fixed and stained for LFA-1 (red). Side view projections are shown at the bottom. SEM images of T cells crawling on identical surfaces are shown in the right panels. Scale bars represent 6 μm.