
Figure 7. High-Affinity LFA-1:ICAM-1 Dots Are Stabilized on the Apical Side of the Leading Edge of Actively Transmigrating T Cells.
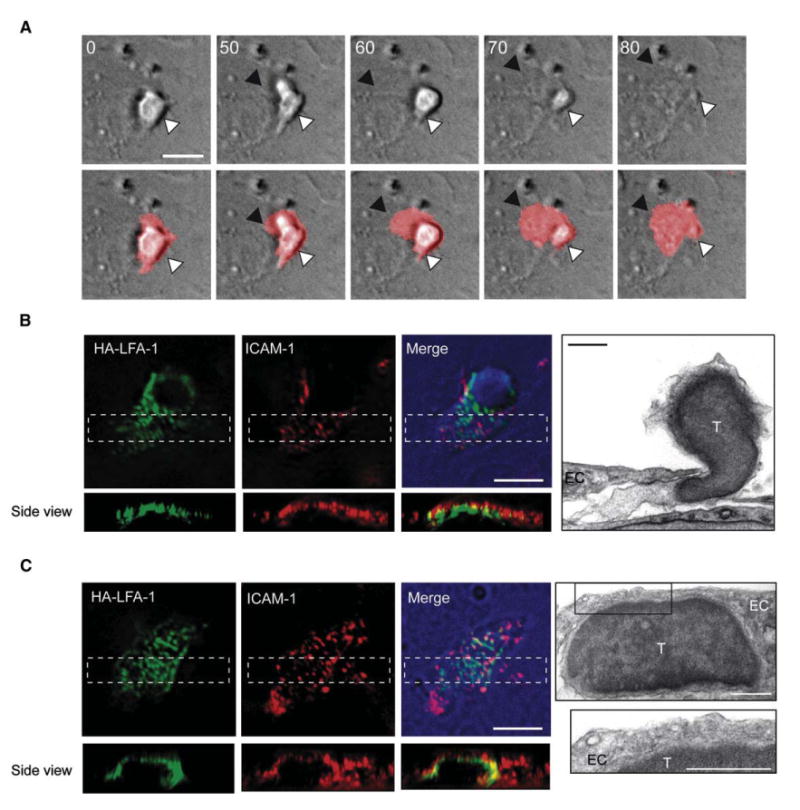
(A) T cells prelabeled with the membranal dye, DiD, were recorded during crawling and TEM across activated-HUVEC bearing CXCL12. Time-lapse images taken from Movie S7. Top and lower panels depict DIC images alone or merged with DiD fluorescence, respectively. The white arrowheads point to the T cell rear adhered to the apical side of the EC, and the black arrowheads mark the leading edge of the transmigrating T cell that engages the subluminal aspect of the EC. The time indicated is in seconds. Scale bar represents 10 μm.
(B and C) T cells migrating through and below activated HUVEC displaying CXCL12 were fixed and stained for HA-LFA-1 and ICAM-1. Fluorescence microscopy images of at least 10 cells (scale bars represent 6 μm) and transmission EM image (scale bars represent 3 μm) are depicted. Images of a T cell undergoing TEM are shown in (B) and Movie S8. Images of a T cell crawling under the EC are shown in (C).