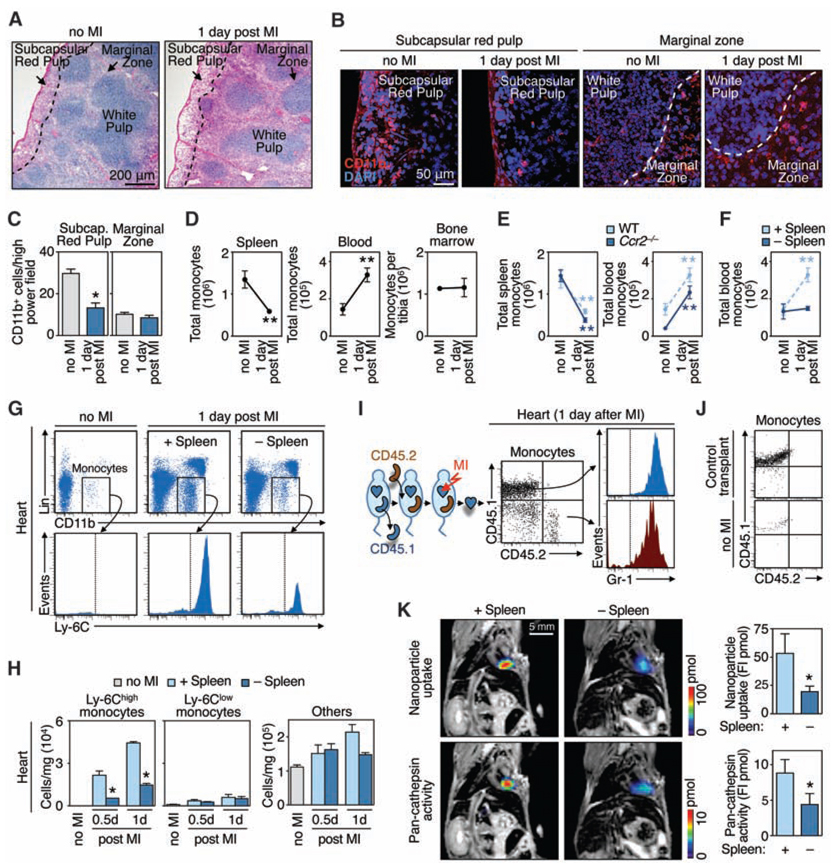
Figure 3.
Splenic reservoir monocytes emigrate from the subcapsular red pulp and populate inflammatory sites. (A) Splenic sections from mice without MI and 1 day after MI stained with hematoxylin and eosin. (B) Splenic sections stained with CD11b-specific antibodies (red) and 4′,6′-diamidino-2-phenylindole (DAPI) (blue) depict the subcapsular red pulp and the marginal zone from mice without MI and 1 day after MI. (C) Enumeration of CD11b+ cells in the subcapsular red pulp and marginal zone (means ± SEM, n = 10 high-power fields). (D) Total number of monocytes in the spleen, blood, or bone marrow (tibia) in control mice (no MI) or 1 day after MI (means ± SEM, n = 6 to 15). (E) Total number of monocytes in the spleen or blood in wild-type (WT) and Ccr2−/− mice in response to MI (n = 3 to 6). (F) Total number of blood monocytes in splenectomized animals (−Spleen) and sham-operated controls (+Spleen) without MI or 1 day after MI (n = 3 to 6). (G and H) Accumulation of cells in heart in the same groups of mice as measured by flow cytometry [(G), n = 3] or by counts per mg tissue [(H), means ± SEM, n = 9]. (I) Accumulation of monocyte subsets originating exclusively from spleen as measured by flow cytometry. Dot plots (CD45.1 versus CD45.2) of gated monocytes and histograms (Gr-1) of each positive population. (J) CD45.1 versus CD45.2 profile of gated monocytes in a mouse receiving a control transplant (pancreas) and in a mouse not subjected to MI. Also refer to fig. S7. (K) FMT-MRI of in vivo phagocytic and proteolytic activities in infarcts. Fluorochrome concentration is shown in the infarcted area, on the basis of MRI-derived anatomy (n = 6). FI, fluorescence intensity. *P < 0.05; **P < 0.005. Data pool at least three independent experiments (D to F, and H), or are from one experiment representative of two [(I) and (J)] or at least three independent experiments [(A) to (C), and (G)]

