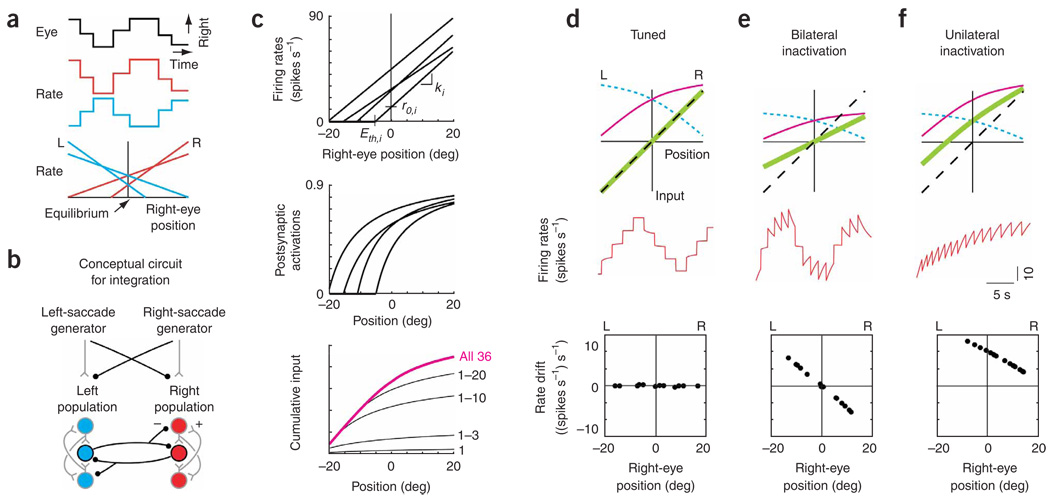
Figure 1. Traditional model of feedback for opposing populations.
(a) Schematic of spontaneous saccadesand fixations accompanying changes in the firing rate of two integrator neurons, and typical relationships between rate and eye position for two right-side (R) neurons (red) and two left-side (L) neurons (blue), (b) Conceptual circuit for an integrator with opposing left and right populations which transforms brief eye velocity commands from saccade generators into sustained eye position commands (black, inhibitory interactions; gray, excitatory). Projections carrying tonic background signals are not shown. (c) Construction of the cumulative input from the right population. Top, fits to experimental relationships between firing rate and eye position for four neurons. The lines were characterized by slopes ki and equilibrium rates r0,i, which set the model neuron gains and tonic background inputs. Eth,i, eye position threshold for recruitment of cell i. Middle, model postsynaptic activations provided by the presynaptic neuronal firing rates above (see Methods). Bottom, cumulative input (magenta) at different positions is given by a weighted sum of the individual activations, with weights fit to satisfy the tuning condition of equation (10). Black traces, intermediate sums calculated from the contributions of the first n = 1,3,10,20 recruited neurons. (d–f) Firing rate dynamics in tuned (d) and disrupted (bilateral, e; unilateral, f) networks. Top, stable positions are maintained wherever the total feedback (green), given by the difference between the inputs from the right (magenta) and left (blue, short dashes) populations, intersects the line representing the perfect-tuning condition (black, dashed; equation (10)). Middle, firing rate of a right-side cell. Bottom, drift in rate during fixations at different eye positions.

