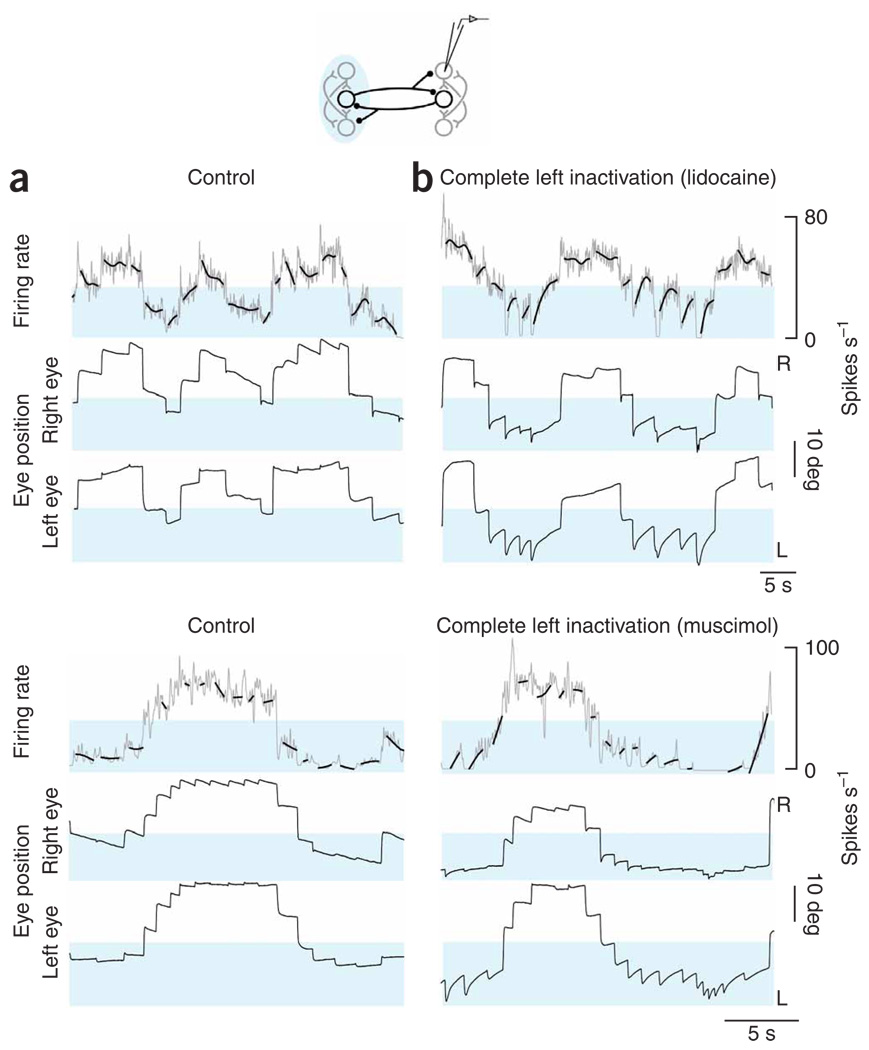
Figure 3. Firing rates in the right population after inactivation of the left.
(a,b) Neuronal panels, firing rates versus time of right-side cells at fine (gray) and coarse (bold black, smoothing spline) resolution before (a) and after (b) complete inactivation of the left population (top, lidocaine; bottom, muscimol). Blue shading highlights firing rates where the greatest changes of rate drift during fixations were seen with inactivation. Control and inactivation rates are shown with the same scale and origin. Eye panels, as in Figure 2a,b. Both controls were taken after recovery from one prior inactivation.

