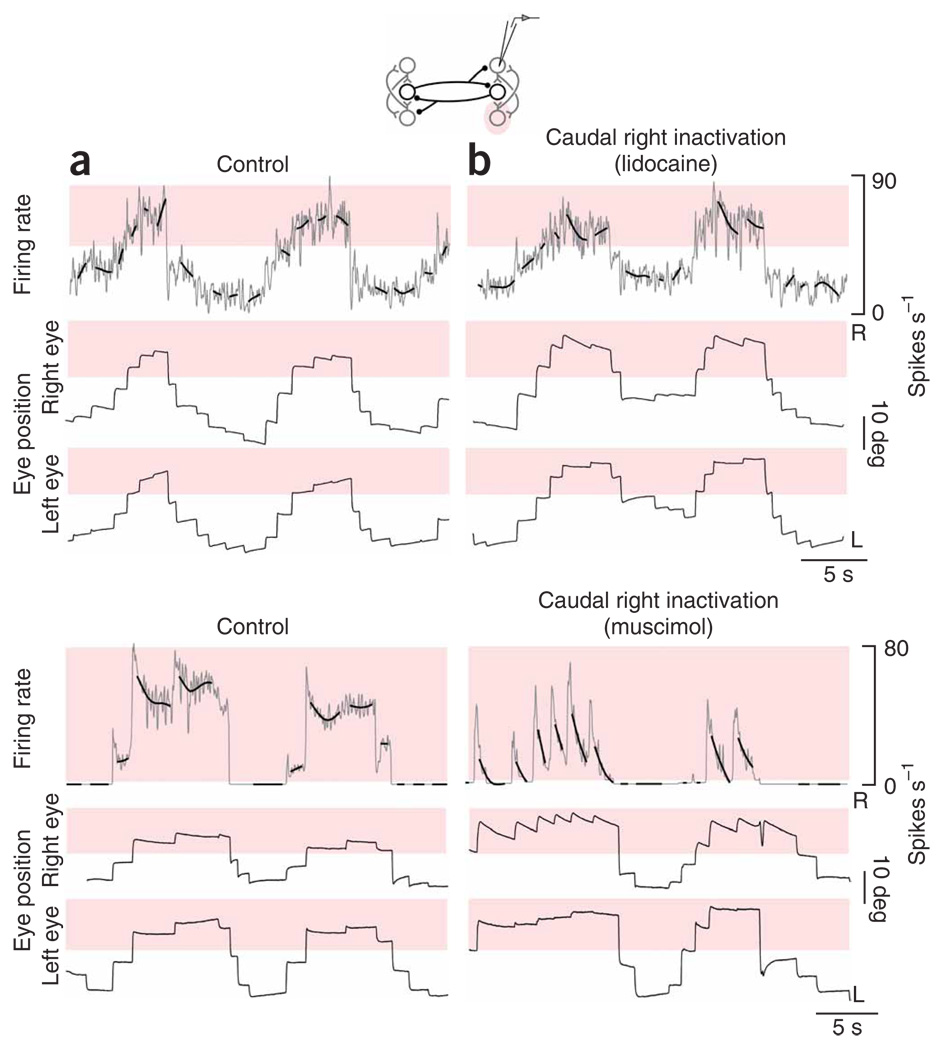
Figure 5. Firing rates in the right population after inactivation of caudal neurons.
(a,b) Neuronal panels, firing rates versus time of rostral right-side cells at fine (gray) and coarse (bold black) resolution before (a) and after (b) inactivation of caudal cells in the right population (top, lidocaine; bottom, muscimol). Red shading highlights firing rates where the greatest changes of rate drift during fixations were seen with inactivation. Eye panels, as in Figure 2a,b. No prior inactivations occurred before the control in this lidocaine experiment. The control in this muscimol experiment was taken after recovery from one prior inactivation. Note that the cell in this muscimol experiment had a high threshold, so that when active it almost always fired above its equilibrium rate.

