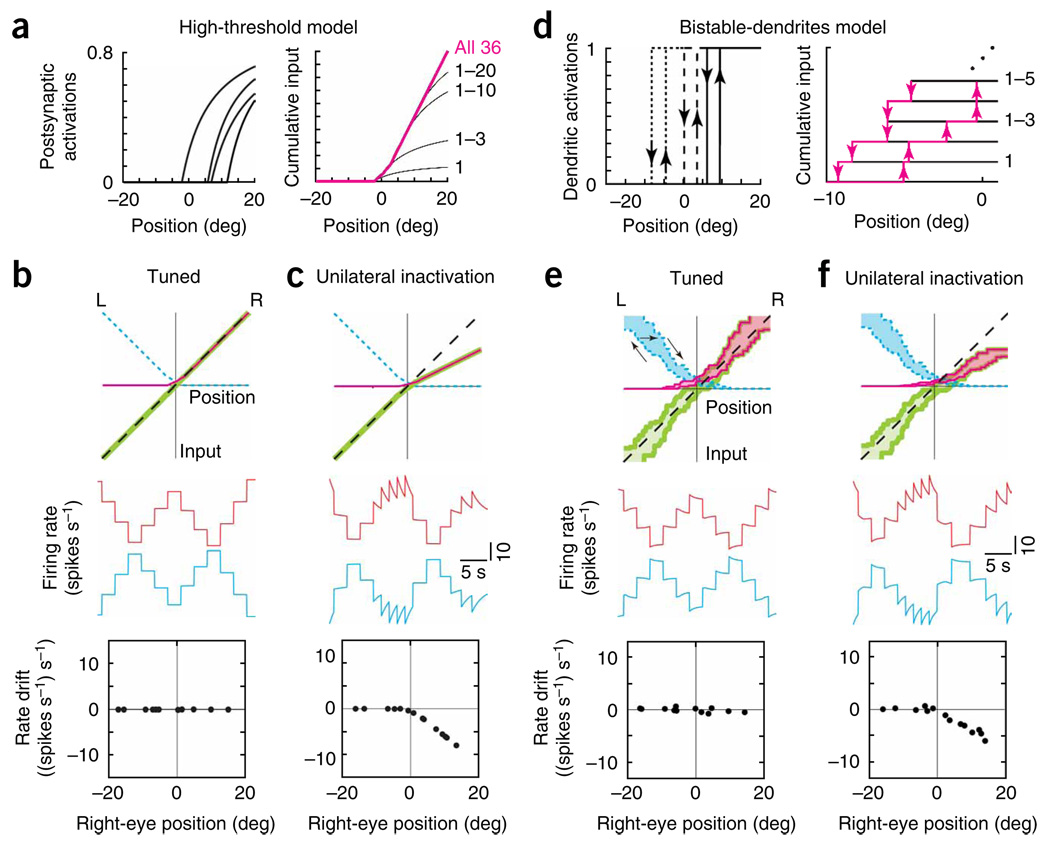
Figure 7.
Models with activation thresholds can explain the asymmetric effects of unilateral inactivations. Panel features are as in Figure 1c,d,f. (a–c) Asymmetric effects of unilateral disruption in the high-threshold model, (a) Left, activation functions provided by the right-side neurons of Figure 1c when their firing rates had to cross a high threshold to trigger a postsynaptic response. Right, with this high threshold, cumulative input from the right population is significant only in the right half of the position range. Neurons are arranged by order of synaptic activation. (b,c) Top, total inputs (magenta, right; blue dashed, left; green, difference) in the tuned (b) and 50% unilaterally reduced (c) conditions. Middle, firing rates versus time of a right-side (red) and left-side (blue) cell. The rates are offset by 40 spikes s−1 vertically. Bottom, drift in rate of the right-side cell. (d–f) Similar asymmetry following unilateral disruption (50%) of the bistable-dendrites model. (d) Left, activations provided by 3 of the right-side neurons of Figure 1c when bistable dendrites are introduced. Localized plateaus turn on (up arrows) in a postsynaptic neuron when the presynaptic neuron's firing rate exceeds a threshold value, and turn off (down arrows) when the rate drops below a lower value. Right, cumulative input provided by the right side, shown explicitly for the first five neurons to cross the firing rate threshold required to activate their postsynaptic targets. (e,f) Recurrent input provided by each population is hysteretic (tuned, e; unilateral, f). Arrows in e (top) indicate a trajectory of the input provided by the left population as the eyes move left and then right.

