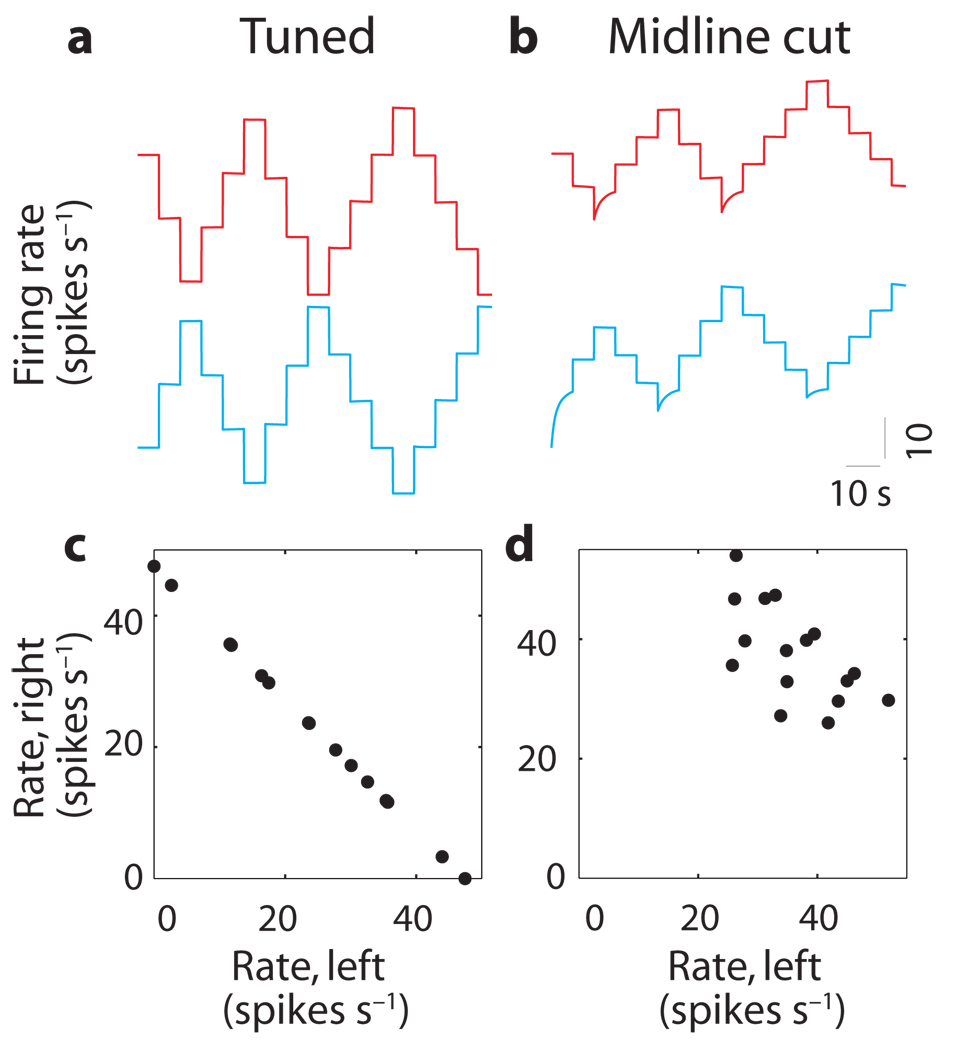
Figure 8. Loss of coordination after loss of mutual inhibition.
(a,b) Firing rates of a left-side (blue) and right-side (red) neuron before (a) and after (b) midline transection of the high-threshold model. Rates are offset by 60 spikes s−1 vertically within each panel and aligned between panels. (c,d) Rate of a left-side neuron versus rate of a right-side neuron during fixations before (c) and after (d) midline transection. Similar results were found in the bistable-dendrites model.

