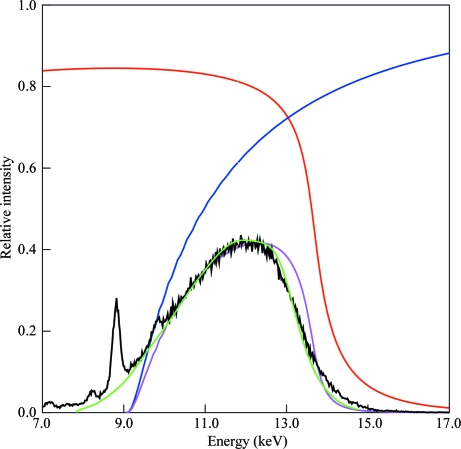
Figure 2.
Predicted and actual spectrum of the 30% bandwidth (FWHM) X-ray beam. Red, calculated reflection from a Rh-coated reflection mirror at 0.28° (4.9 mrad). Blue, calculated transmission through an Si3N4 transmission mirror at 0.24° (4.2 mrad). Magenta, calculated spectrum produced by two reflections and one transmission. Black, spectrum measured using Compton scattering from a Kapton foil. The sharp peaks arise from fluorescent scattering from impurities in the foil and are not present in the incident X-ray beam. Green, spectrum determined from Laue data modeled with 15 Chebyshev polynomials. The heights of the black and green curves have been scaled to match the magenta curve.

