Figure 6.
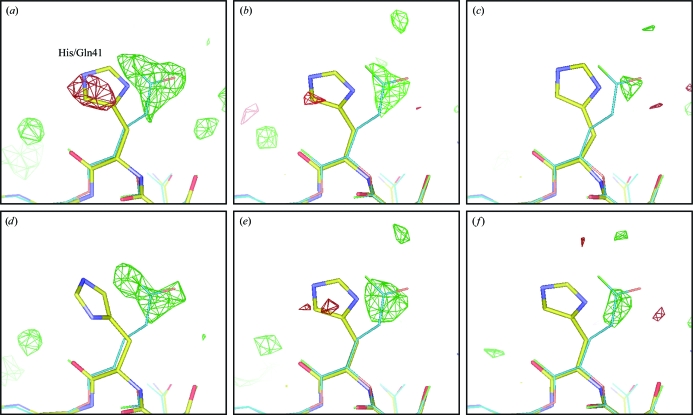
Difference Fourier maps around residue 41, which is His in turkey lysozyme and Gln in chicken lysozyme. The contour level is 3σ, with green for positive and red for negative peaks. The data sets used were (a) monochromatic ‘complete’, (b) Laue ‘best’, (c) Laue ‘small firsts’, (d) monochromatic ‘small’, (e) Laue ‘firsts’, (f) Laue ‘single-crystal’; see the text for the definitions of these designations. The structure of turkey lysozyme after refinement but before mutations is shown as multicolored sticks; the corresponding part of chicken lysozyme from PDB entry 1bwh is shown as thin blue sticks. Maps and model were displayed using Coot.

