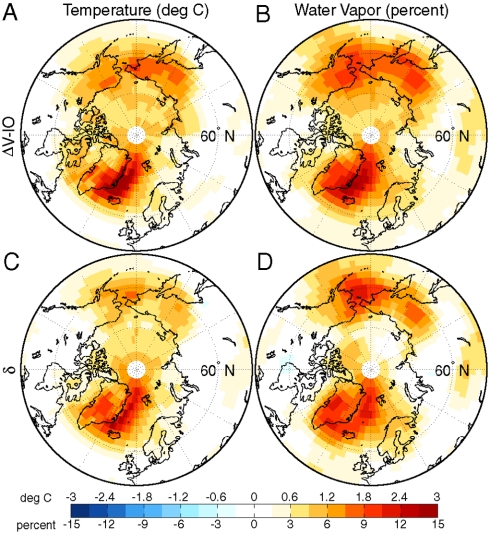
Fig. 2.
(A) The anomaly (ΔV - IO) in near-surface atmospheric temperature in degrees Celcius (deg C) between a model experiment where trees are introduced on bare ground north of 60 °N and a corresponding control run with no added trees. (B) The same as (A) for column water vapor in percent. (C) The difference δ(ΔV - IO-ΔV-FO) in near-surface atmospheric temperature in deg C between two anomalies where trees are introduced on bare ground north of 60 °N, one with an interactive ocean model (V-IO), and the other with fixed ocean and sea-ice (V-FO). (D) The same as (C) for column water vapor in percent.

