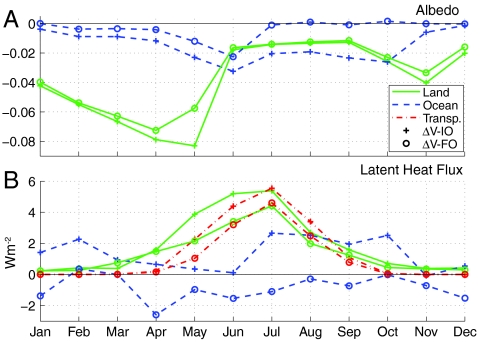
Fig. 3.
(A) Albedo anomalies averaged over land area north of 60 °N (Green solid line), ocean area north of 60 °N (Blue dashed line). Plus signs represent results from the interactive ocean model (ΔV - IO) and open circles represent results from the fixed ocean model (ΔV-FO). (B) Same as for (A) for latent heat flux anomalies and transpiration averaged over land area north of 60 °N (Red dashed-dot line).

