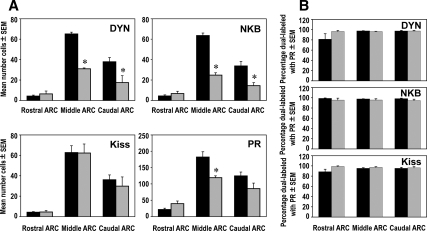
Figure 6.
A, Differences in the mean number (±sem) of DYN-, NKB-, kisspeptin (Kiss)-, and PR-positive cells in the rostral, middle, and caudal divisions of the ARC in control (black bars, n = 5) and prenatal T-treated (gray bars, n = 4) ewes. *, P < 0.05. B, Mean percentage (±sem) of either DYN, NKB, or kisspeptin (Kiss) cells that colocalized PR in the rostral, middle, and caudal divisions of the ARC in control (black bars, n = 5) and prenatal T-treated (gray bars, n = 4) ewes.

