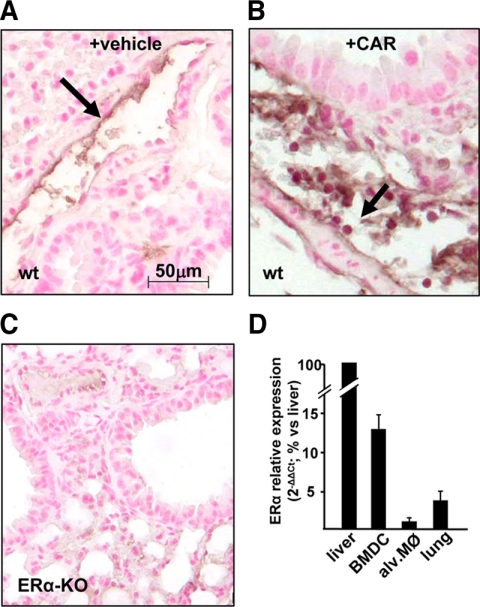
Figure 3.
ERα expression in lung and inflammatory cells. Representative immunohistochemistry images of lung from vehicle (A) and CAR-treated sham (B) or untreated (C) ERα-KO female mice analyzed with an ERα-specific antibody. ERα-positive cells are visible in endothelial cells of the vessel wall (arrow in A) and in round-shaped cells in proximity of vessels (arrow in B). D, Expression levels of the ERα gene was evaluated by real-time PCR on the mRNA extracted from BMDCs, alveolar macrophages (alv. MØ), and lung tissue and represented in relation with ERα mRNA from liver. Each data point represent the average ± sem of samples from three female mice analyzed in triplicate.

