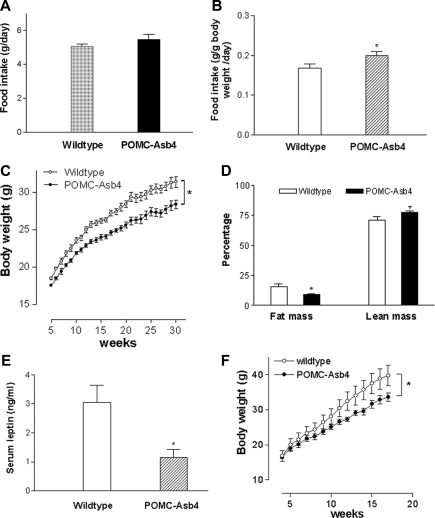
Figure 4.
Food intake, growth, body composition, and leptin levels of POMC-Asb-4 transgenic mice. A and B, Daily food intake for wild-type and POMC-Asb-4 mice per mouse per day (A) or per gram body weight per day (B). Error bars indicate sem. *, P < 0.05 vs. wild-type mice. Eight animals were examined for each group. C, Growth curves for POMC neuronal specific Asb-4 transgenic and wild-type mice. Weights were measured at indicated intervals. Each time point is expressed as mean ± sem for groups of eight mice. *, P < 0.01 between the two groups as determined by two-way ANOVA. D, Body composition of transgenic and wild-type mice. Error bars indicate sem. *, P < 0.05 vs. wild-type mice. E, Serum leptin levels of transgenic and wild-type mice. *, P < 0.05 vs. wild-type mice. F, High-fat-induced obesity in transgenic and wild-type mice. *, P < 0.01 between the two groups as determined by two-way ANOVA.

