Figure 5.
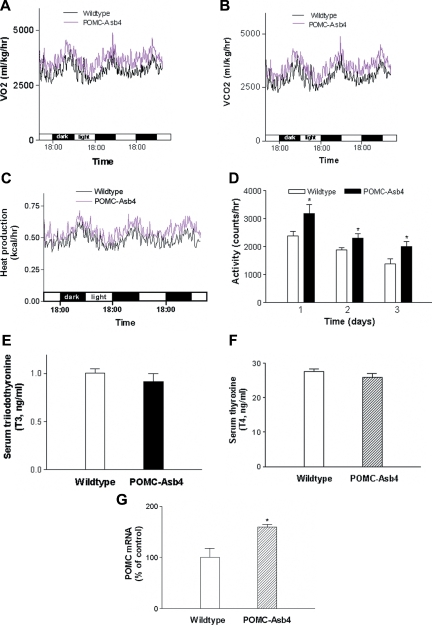
Energy expenditure and motor activity in wild-type and POMC-Asb4 animals. A, VO2; B, VCO2; C, total heat production. Each curve represents mean values derived from seven animals per group. P < 0.01 between the two groups for VO2, VCO2, and total heat production as determined by two-way ANOVA. D, Spontaneous motor activity. *, P < 0.05. E and F, Circulating T3 (E) and T4 (F) levels in wild-type and transgenic mice. G, POMC mRNA levels in the ARC. *, P < 0.05.

