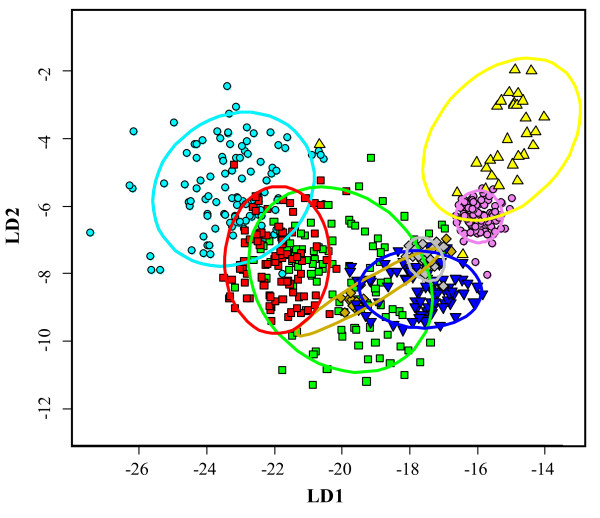
Figure 3.
Discriminant analysis of total base composition of Rag1. Results of the linear discriminant analysis along the first and second discriminant axes (LD1 and LD2, respectively). LD1 and LD2 account for 80% and 18% discriminant power, respectively. 95% probability ellipses are indicated for each group. Each color corresponds to a different lineage. Color code is similar to the one in Figure 4. Light blue circle = Actinopterygii, green square = Amphibia, violet circle = Aves, yellow up triangle = Chondrichthyes, gold diamond = Crocodylia, blue down trianle = Lepidosauria, red square = Mammalia, grey diamond = Testudines.

