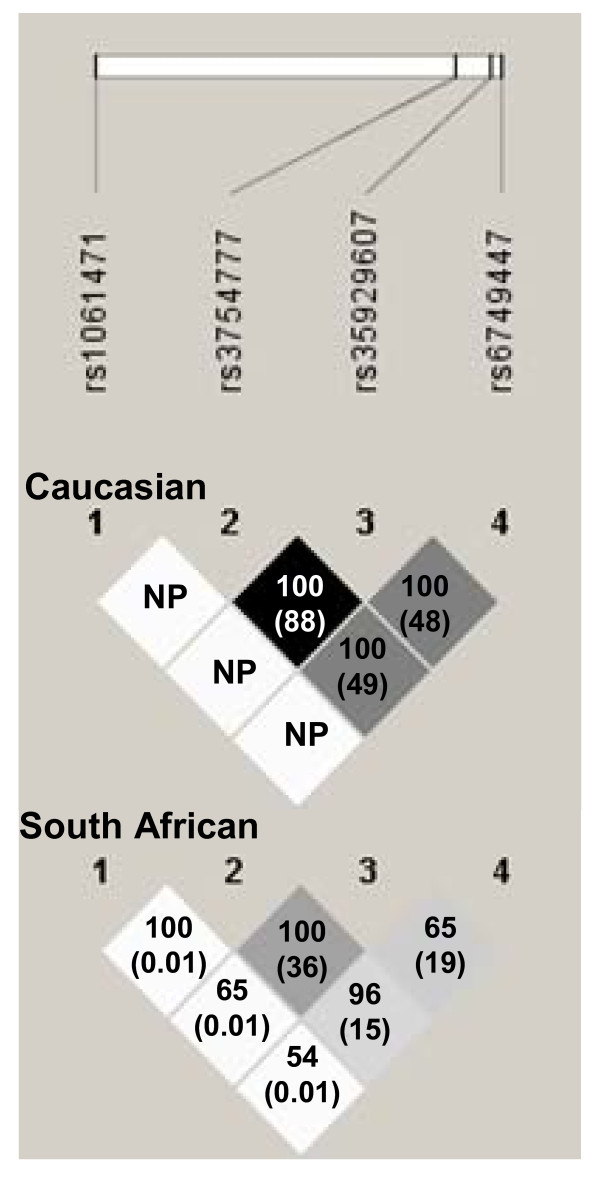
Figure 2.
Linkage disequilibrium between typed SNPs at the chromosome 2q24 STK39 locus in Caucasian and South African participants. Shading represents r2 values (r2 = 0 white, 0 < r2 < 1 shades of grey, r2 = 1 black). Numbers show D' values (and r2 values in brackets) between SNPs. NP, non-polymorphic in Caucasian population. Figure adapted from Haploview.

