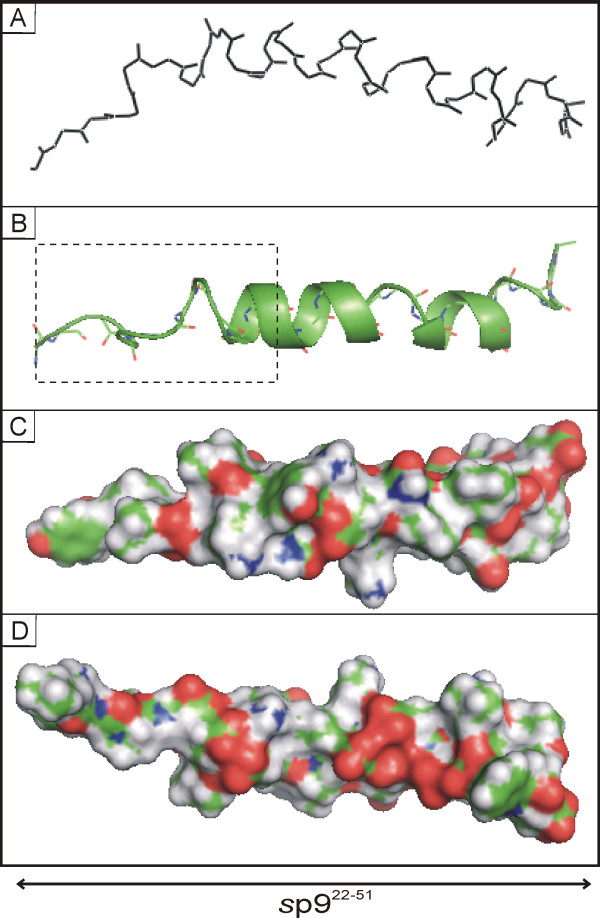
Figure 7.
Final structure of sp922-51 in 50% TFE. (A) Central structure of sp922-51 that shows the lowest average rmsd value to all other final structures. (B) Ribbon plot of the same showing helical regions. The boxed area corresponds to the position of the ALIX-binding domain. (C) Space-filling representation of the central structure in the same orientation as in A. (D) Space-filling representation rotated 180°.

