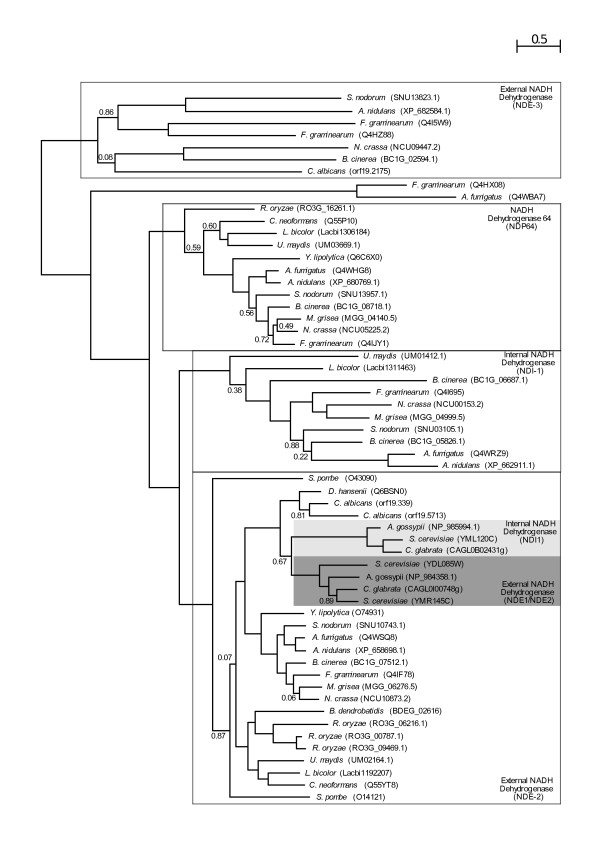
Figure 5.
Phylogenetic tree representing the evolution of the alternative dehydrogenase protein family. The model used was WAG and approximate Likelihood (aLRT) support of the tree partitions is indicated if lower than 0.9. Duplications involving S. cerevisiae were marked with coloured boxes, while those involving N. crassa are indicated with white boxes. The species name is followed by the protein name according to the database from which the sequences where retrieved. Functional annotations were taken from Saccharomyces Genome Database (S. cerevisiae) [39] and the Broad Institute (N. crassa). This tree represents a subset of the sequences used in the analysis, the tree with the full set of sequences can be accessed in the additional file 1.

