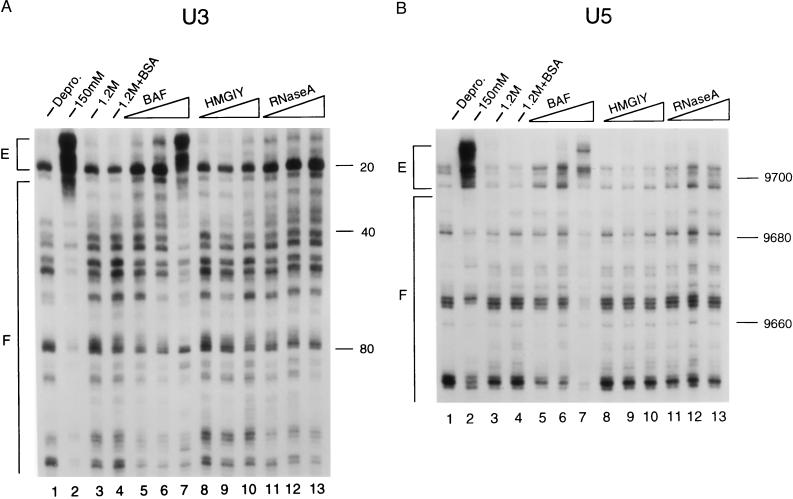
Figure 4.
Structural reconstitution of the HIV-1 intasome with purified BAF. Salt-stripped PICs were reconstituted with the indicated proteins and analyzed by MM-PCR footprinting. A and B present the results for the U3 and U5 ends, respectively. Lanes 1–4, as indicated. Lanes 5–7 included 12.5, 25, and 50 ng of BAF per reaction. The integration activities of these reconstitution mixtures were undetectable, and about 8% and 35% of the activity of the untreated native sample was detected, respectively (data not shown). Lanes 8–10 included 2,000, 8,000, and 16,000 ng of HMG I(Y) per reaction. These mixtures displayed undetectable, and about 7% and 11% of the activity of the untreated sample, respectively (data not shown). Lanes 11–13 contained 2,000, 8,000, and 16,000 ng of RNase A per reaction. The mixture containing 2 μg of RNase A displayed about 20% of the activity of the untreated sample; the mixture with 16 μg displayed about 35% activity. Other labeling is the same as in Fig. 2.

