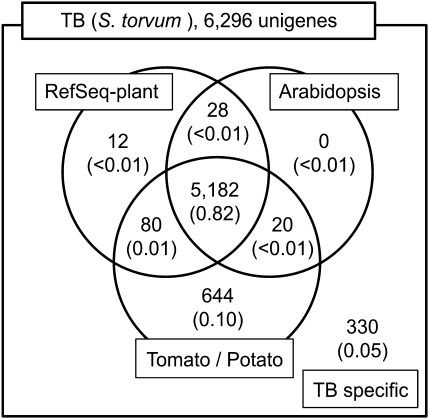
Fig. 4.
Classification of the TB unigenes based on a sequence similarity search against known plant sequence data sets. Figures indicate the number of TB unigenes that showed significant sequence similarity (E-value ≤10−5) by BLAST search. Figures in parentheses indicate the ratio of unigene number in each class to the total unigene number.

