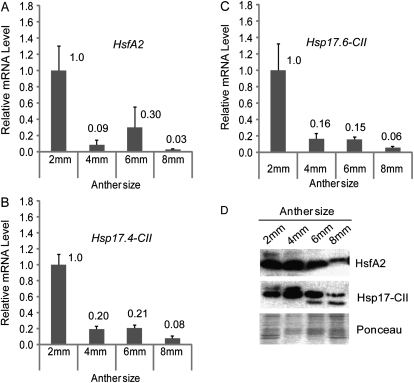
Fig. 3.
Expression analyses of HsfA2 and Hsp17-CII during anther development. (A–C) Relative mRNA levels of HsfA2 (A), Hsp17.4-CII (B), and Hsp17.6-CII (C) in different sized anthers under CT conditions (26 °C / 19 °C, day/night). Expression data were normalized using LeEF1 and 18S rRNA as housekeeping genes. The mRNA levels of the target genes in 4, 6, and 8 mm anthers are relative to that from 2 mm anthers (value 1). The experiment shown here is one of two biological replicates, which showed a comparable expression pattern. Each graph represents the data of two technical repeats. (D) Immunoblotting analyses of the proteins isolated from the same samples as in A, B, and C using specific antisera against HsfA2 and Hsp17-CII. Ponceau staining of total protein was used as control for equal loading.

