Fig. 2.
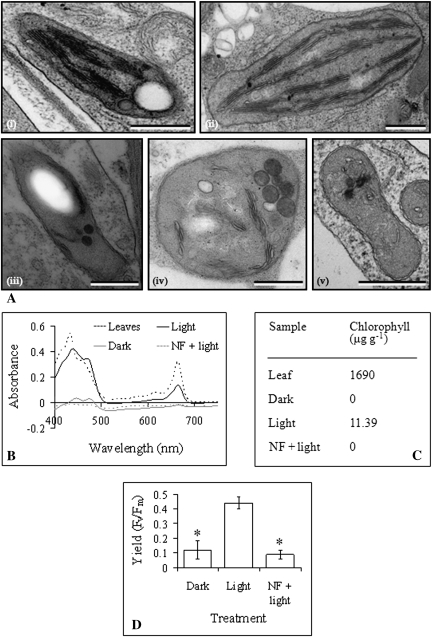
Evidence for the presence of functional chloroplasts in light-grown A. thaliana culture cells. (A) Transmission electron microscopy images of a typical plastid from A. thaliana (i) light-grown culture, (ii) leaf tissue, (iii) dark-grown culture, (iv) norflurazon-treated light-grown culture, and (v) spectinomycin-treated light-grown culture. Scale bars represent 500 nm. (B) Absorbance spectra of pigments extracted from A. thaliana leaves and cells from dark-grown, light-grown, and norflurazon-treated light-grown cultures. (C) Chlorophyll concentrations (per g fresh weight) in A. thaliana leaves and cells from dark-grown, light-grown, and norflurazon-treated light-grown cultures, as determined using absorbance values taken from the absorbance spectra in (B). (D) Average fluorescence yield (Fv/Fm), representing photosynthetic potential of chloroplast photosystem II, of A. thaliana dark-grown, light-grown, and norflurazon-treated light-grown (NF+light) culture cells. Values are means and error bars represent SD (n ≥3 replicates). Fluorescence yield values marked with an asterisk were significantly different from fluorescence yield in light-grown cultures (P <0.001).

