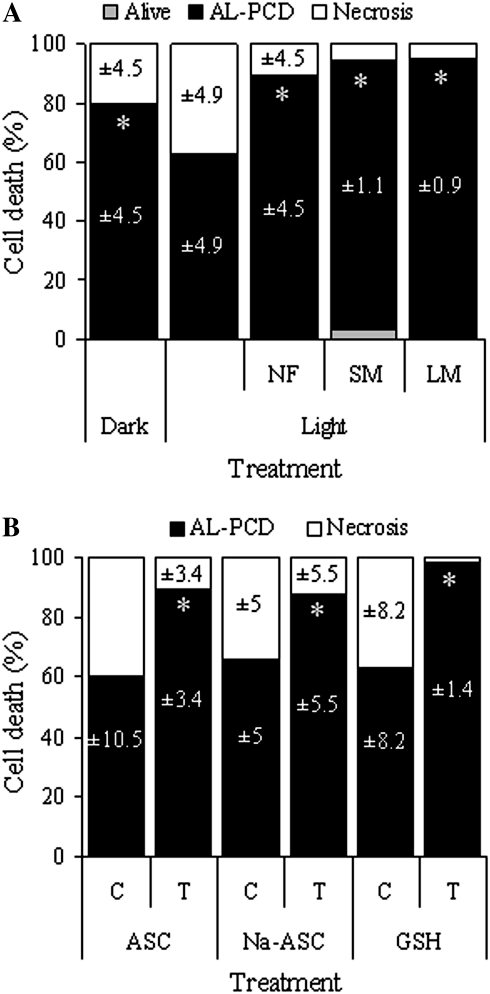
Fig. 4.
Evidence suggesting chloroplast and ROS involvement in AL-PCD. Percentage of AL-PCD, necrosis, and living cells in cultures, scored using the cell morphology marker of AL-PCD, 24 h after heat treatment. Values are means ±SD (n ≥3 replicates). (A) Dark-grown cultures and light-grown cultures, untreated and treated with the chloroplast inhibitors norflurazon (NF), spectinomycin (SM), and lincomycin (LM). PCD values marked with an asterisk were significantly different from PCD in untreated light-grown cultures (P=0.026 for dark-grown cultures and P <0.001 for NF, SM, and LM-treated cultures). (B) Light-grown cultures, control (C; untreated) and treated (T) with the antioxidants ascorbate (ASC), sodium ascorbate (Na-ASC), and reduced glutathione (GSH). PCD values marked with an asterisk were significantly different from PCD in the untreated control for that treatment (P=0.001 for ASC and Na-ASC and P <0.001 for GSH).

