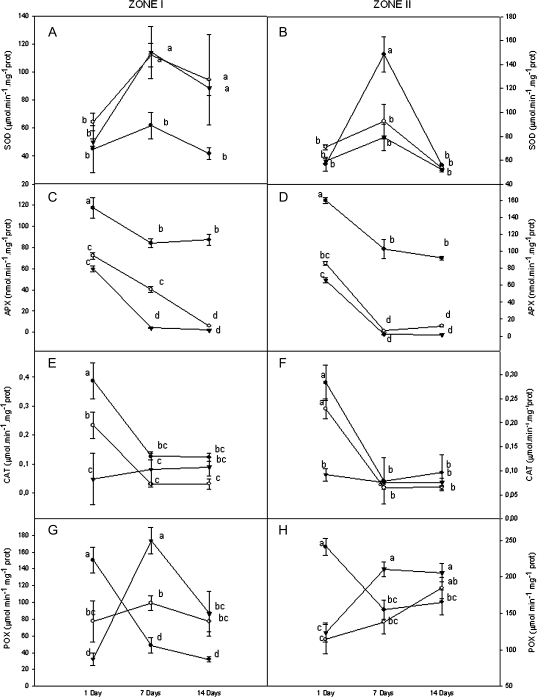
Fig. 4.
Time course of SOD, APX, CAT, and POX enzyme activities in zone I (A, C, E, and G) and zone II (B, D, F and H) of Brassica oleracea roots grown under control conditions (inverted triangles), and with 40 mM NaCl (open circles) and 80 mM NaCl (filled circles). Values represent the means ±SD of five different samples. Significant differences (P <0.05) between days and treatments are indicated by different letters according to Tukey's test.

