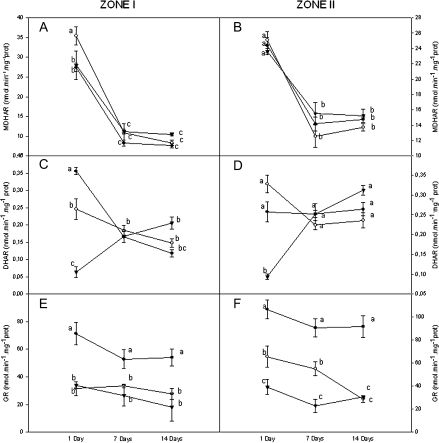
Fig. 7.
Time course of MDHAR, DHAR, and GR enzyme activities in zone I (A, C, and E) and zone II (B, D, and F) of Brassica oleracea roots grown under control conditions (inverted triangles), and with 40 mM NaCl (open circles) and 80 mM NaCl (filled circles). Values represent the means ±SD of five different samples. Significant differences (P <0.05) between days and treatments are indicated by different letters according to Tukey's test.

