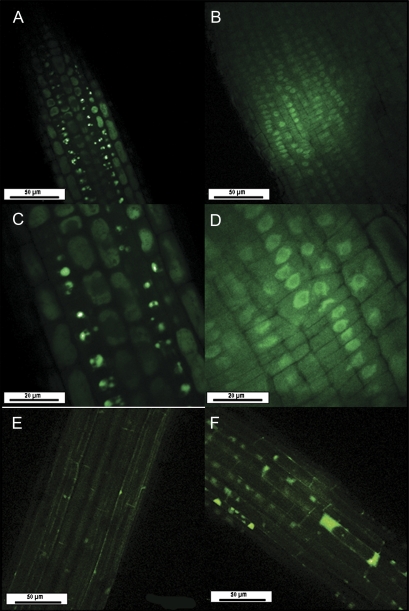
Fig. 8.
In situ location of glutathione in control (A, C, and D) and salt-treated roots (80 mM NaCl, E and F)) of Brassica oleracea during 24 h. Root sections were treated with dye solution (monochlorobimane) and images were taken by confocal laser scanning microscopy after an incubation period of 1 h. The fluorescent GSB conjugate was visualized in a single optical section of root. Zone I (A and B; C and D are magnifications of the same image in C and D) and zone II (E and F).

